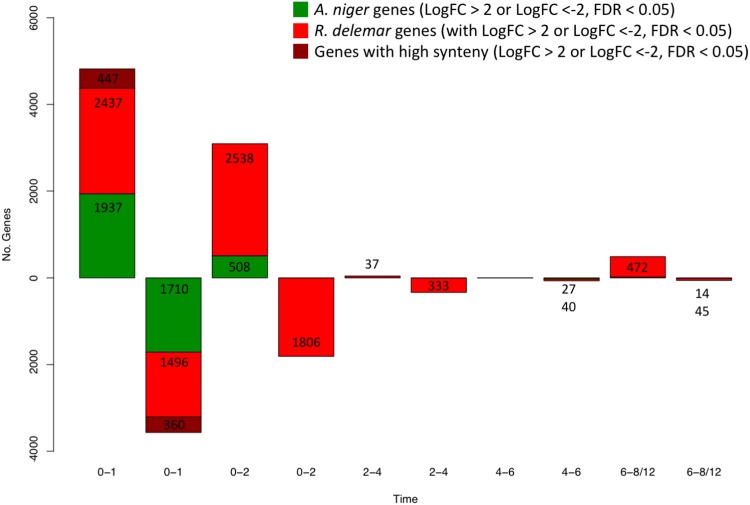
FIG 7.
Number of homologous genes significantly differentially expressed (multiply corrected P value of <0.05) between time points, shown over time. Green represents the number of A. niger genes, red represents the number of R. delemar genes, and dark red represents the number of R. delemar genes found in high-synteny regions of the R. delemar genome.

