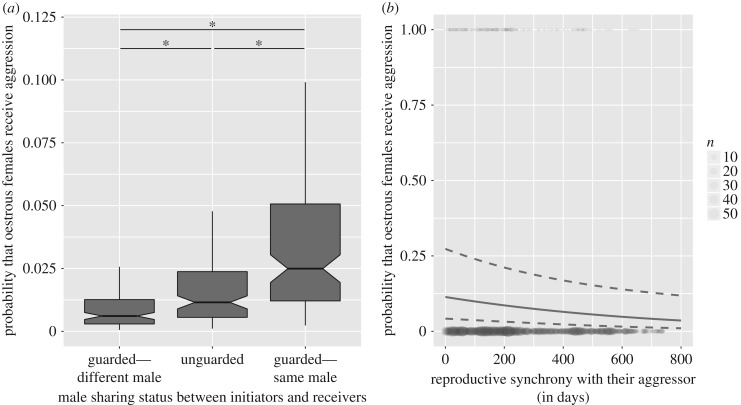
Figure 1.
Predicted probability that oestrous females receive aggression from pregnant and lactating females, according to (a) their male sharing status and (b) their reproductive synchrony. In (a), boxplots are drawn from the distribution of the predicted probabilities, while varying the rank of actors and receivers between 0 and 1, and using the mean for other numerical values (for a reproductive synchrony of 259 days and a time in proximity of 0.21 min), in J troop in 2014 for categorical variables. Comparisons between the different levels of the variable ‘male sharing status’ are denoted by an asterisk if statistically significant. In (b), the solid line is the model prediction, and the dotted lines represent the 95% confidence interval. The prediction line is drawn for a dyad sharing a male, that spends 0.21 min in proximity, where the initiator has rank 1 and receiver has rank 0.5, in J group, in 2014. The grey dots represent the raw data of whether an aggression was exchanged (1) or not (0) within the dyad, and their size is proportional to the number of occurrences in the dataset.

