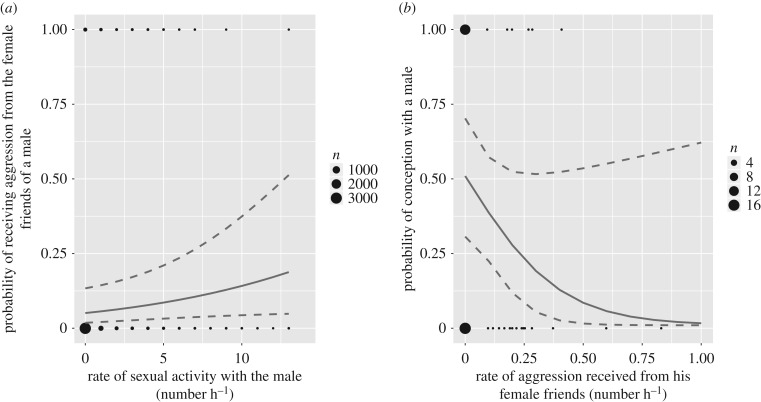
Figure 2.
Predicted probability that oestrous females (a) receive aggression from the female friends of a male, according to their sexual activity with the male and (b) conceive with a male according to the rate of aggression received from the female friends during the oestrus period. Solid lines represent the model predictions and the dotted lines the 95% confidence interval. In (a), the prediction line is drawn holding all other fixed effects constant, using the mean for numeric variables (for a mate-guarded oestrous female of rank 0.53, that spends 0.37 min in proximity of the female friends, 7 days before the POP, and a male of rank 0.67, having 2.15 female friends), in J group, in 2014 for categorical variables. In (b), the prediction line is drawn using the mean ranks for female and male (0.57, and 0.79, respectively) and the mean rate of aggression from other females (0.28 aggressive act h−1). The black dots represent the raw data: whether aggression was exchanged (1) or not (0) in (a), and whether conception occurred (1) or not (0) in (b), and their size is proportional to the number of occurrences in the dataset.

