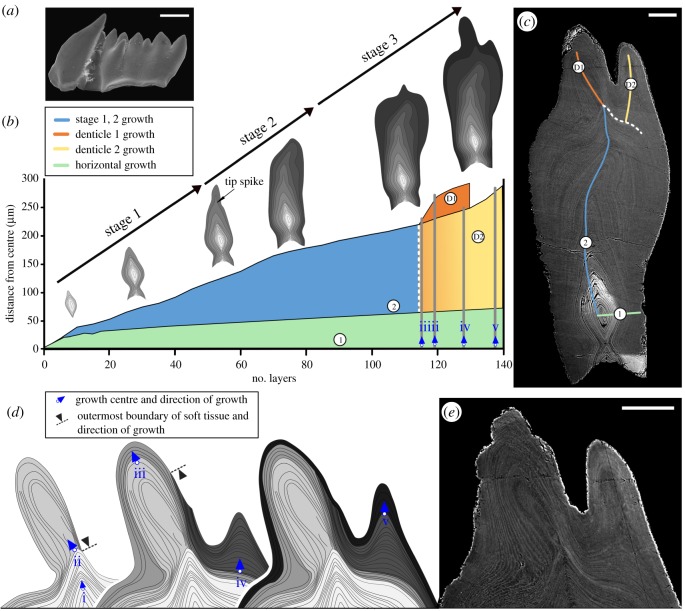
Figure 2.
Growth dynamics and ontogenetic development of pathologically developed Ozarkodina confluens. (a) Overview of the specimen in scanning electron microscopy (SEM) (scale bar 200 µm). (b) Morphological change calibrated with individual growth layers (lamellae of the crown tissue). The graph represents growth rates during life, ontogenetic development, preference of growth direction during life, and the areas in which growth centres could be identified (growth centre (i) corresponds to the base of the growth axis). (c) Composite BSE image of polished thin section (scale bar 50 µm). (d) Reconstruction of the development of growth centres (ii–v) and the inferred extent soft tissue over the surface of the element. (e) BSE image of malformed denticles (D1 and D2; scale bar 50 µm). (Online version in colour.)

