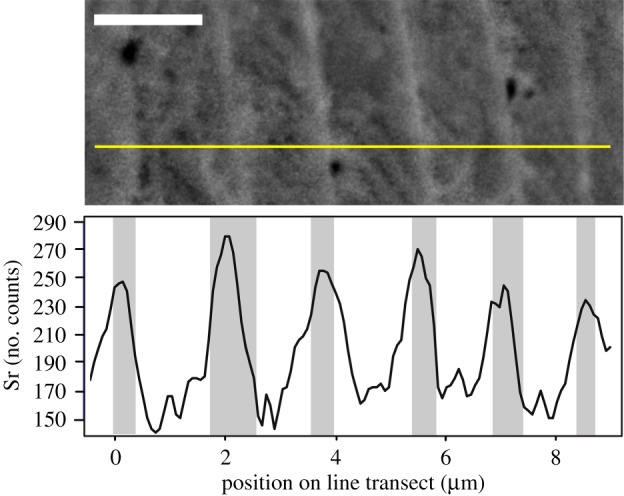
Figure 4.

Sr concentration fluctuations recorded within individual lamellae of Ozarkodina confluens. Horizontal line in the upper half of the image represents the location of the high-resolution EDX line transect. Scale bar 2 µm. (Online version in colour.)
