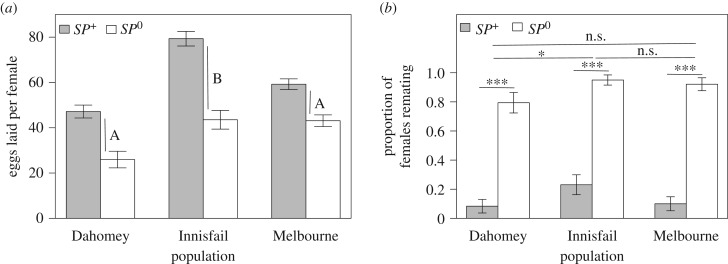
Figure 1.
Female PMRs to receipt of SP 24 h after a single mating to either an SP+ (grey bars) or an SP0 (white bars) male. (a) Mean number of eggs (±s.e.) produced per female. Different letters correspond to significant differences (p < 0.05) in contrasts of female population × male genotype interactions. (b) Proportion of females remating (± s.e.) with a Dahomey male within 1 h. Asterisks correspond to significant differences (***p < 0.001, **p < 0.01, *p < 0.05, n.s. = non-significant) in remating propensity depending on male genotype within populations and between populations.

