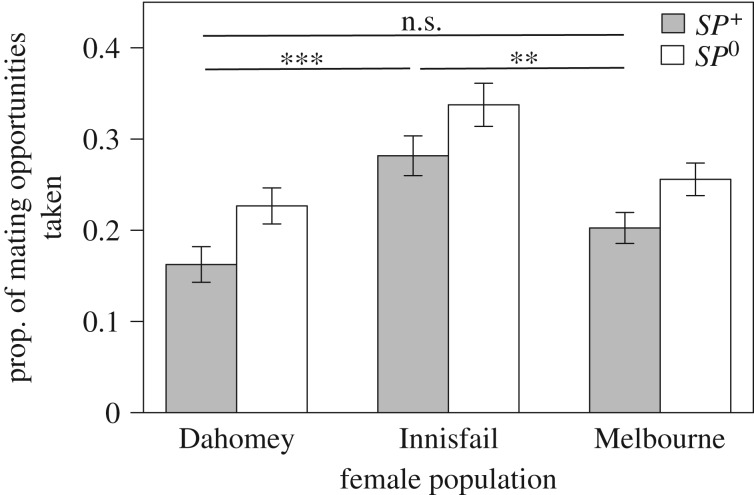
Figure 2.
Mating frequency of females continuously exposed to SP+ (grey bars) or SP0 (white bars) males throughout their lives. Mating frequency was recorded twice a week for 3 h directly after lights on by checking the number of mating pairs every 20 min until all females were dead. Asterisks correspond to significant contrasts (***p < 0.001, **p < 0.01, *p < 0.05, n.s. = non-significant) in mating frequency between females from different populations mated to SP+ males (the pattern was similar when comparing females from different populations mated to SP0 males).

