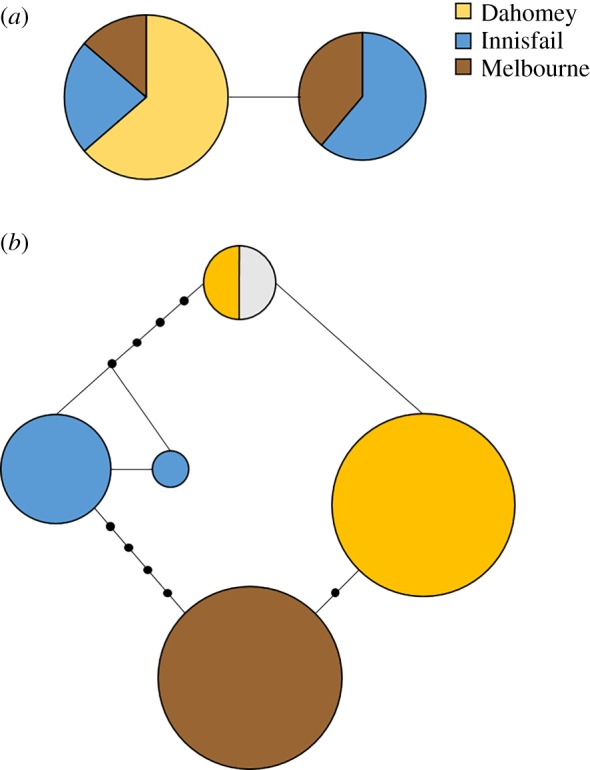
Figure 4.

Haplotype networks of (a) the SP gene and (b) exon 6 of the SPR gene. Circle size represents the number of individuals carrying a specific haplotype and colour population affiliation. Each line segment represents a single mutational event with black dots indicating inferred haplotypes. Colours correspond to one of the three wild-type populations: yellow, Dahomey; blue, Innisfail; brown, Melbourne; grey, reference sequence from flybase (FBgn0029768).
