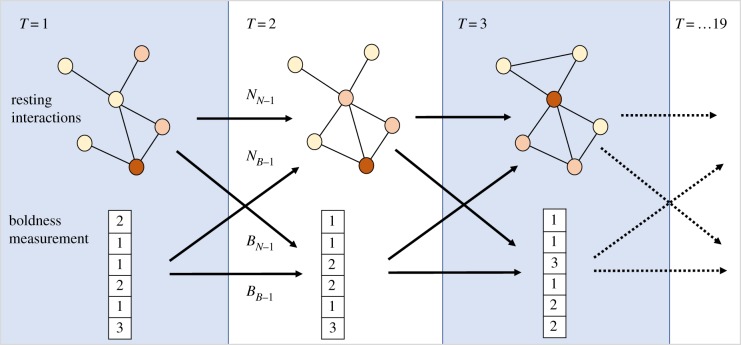
Figure 1.
Network–boldness co-dynamics in the SAOM framework. Each panel is one time point (observation), denoted as T = 1–19. Node (spider) colours indicate boldness which is also listed for each individual in the table below each network. Spider social interactions, which are physical contacts between resting spiders, are represented, for each observation, by undirected, unweighted edges. Arrows between observations indicate possible mechanisms of causal influence: current boldness measurement may depend on the social position of individuals in the previous observation (BN−1); network interactions may be shaped by the individuals' boldness in the previous observation (NB−1); network structure in one observation may result from the social interactions in the previous observation (NN−1), and boldness in one observation may result from the boldness in the previous observation (BB−1). SAOM allows us to estimate all four effects. Figure adapted from [24]. (Online version in colour.)

