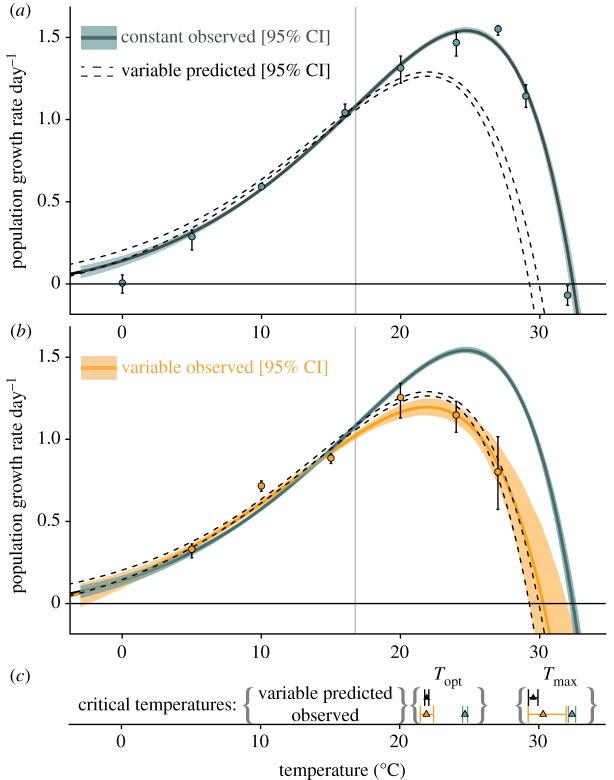
Figure 2.
TPCs for T. tetrahele populations growing under constant and variable temperature conditions. (a) Exponential growth rates under constant-temperature conditions; green line is the fitted TPC and green shading corresponds to 95% CI generated from non-parametric bootstrapping. The dashed curve represents predicted mean growth rate and 95% CI under thermally variable conditions (±5°C) based on nonlinear averaging (equation (2.1)). Points and error bars are observed mean growth rates generated by estimating exponential growth rates at each mean temperature separately (‘indirect’ approach described in the electronic supplementary material, appendix A; error bars represent 95% CI). (b) Exponential growth rates under thermally fluctuating conditions (±5°C); dashed curve is predicted based on panel (a) and equation (2.1), orange line is the fitted TPC under fluctuating conditions, orange shading corresponds to 95% CI generated from non-parametric bootstrapping. Orange points and error bars are observed mean growth rates in the fluctuating temperature regime (estimated via the ‘indirect’ approach, electronic supplementary material, appendix A; error bars represent 95% CI). (c) Predicted and observed  and
and were statistically indistinguishable (predicted: black triangles and 95% CI error bars, observed: orange triangles and 95% CI error bars), and lower than observed Tmax and Topt in constant conditions (green triangles and 95% CI error bars).

