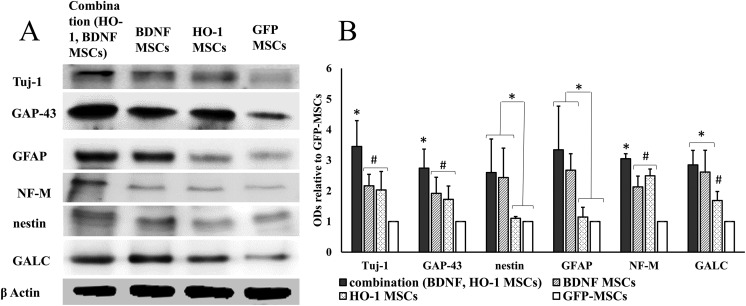
Figure 4.
Expression of neural markers. (a) The densities of neural markers. (b) Quantitative data obtained by densitometry showing optical densities (ODs) relative to GFP-MSCs. The expression of Tuj-1, GAP-43, and NF-M was significantly increased in the combination group compared to the other groups (*P ≤ 0.05), while it was the same between BDNF and HO-1-MSCs groups, but significantly higher than the GFP-MSCs group (#P ≤ 0.05). The expression of nestin, GFAP, and GALC was the same in the combination and BDNF groups, but significantly higher than the HO-1- and GFP-MSCs groups (*P ≤ 0.05). GALC was also significantly higher in the HO-1 group compared to the GFP-MSCs group (#P ≤ 0.05). The graph represents mean ± standard error of four dogs per groups, as determined by densitometry relative to β-actin.

