Figure 7.
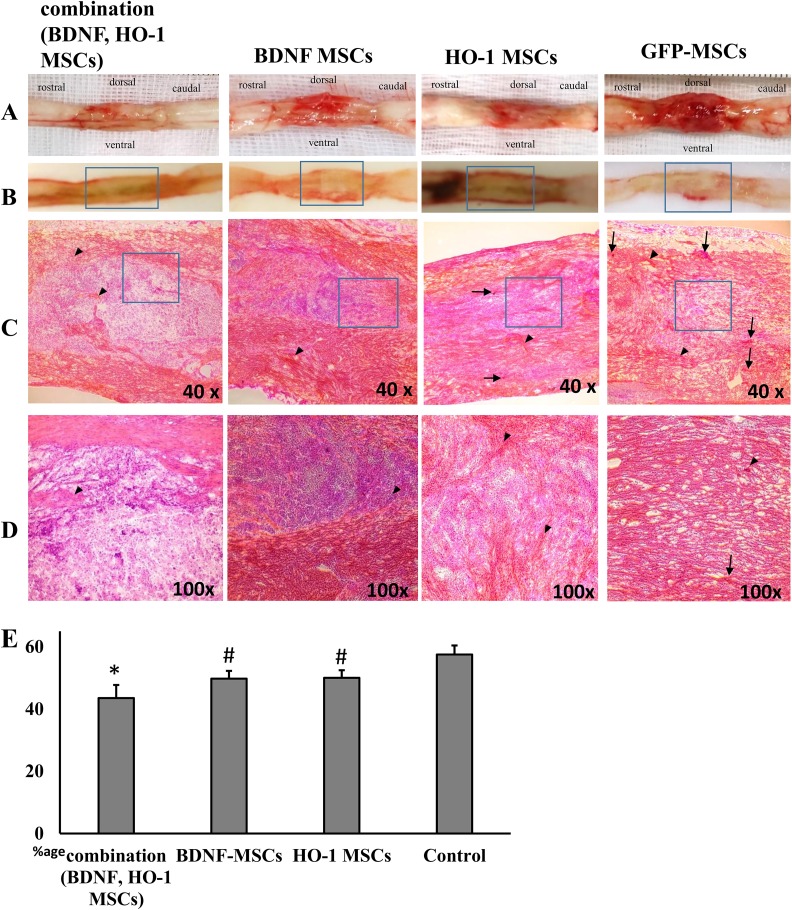
Histopathology of spinal cord lesions stained with H&E stain. (a) An injured spinal cord showed fibrosis, atrophy, and hemorrhages. (b) Spinal cords sliced at the injured segment. (c) The fibrotic (red and pink) and healthy areas (purple) at the injured spinal cord section, at low magnification (40×), and (d) at high magnification (100×); scale bar 200 μm. (e) Percentage expression of fibrotic area. There is fibrosis at the epicenter that covers most of the healthy areas at the injured segment (c). The percentage fibrosis in the combination group was lower than in the other groups ((e), *P ≤ 0.05), followed by lower fibrosis in BDNF- and HO-1-MSCs groups compared to GFP-MSCs ((e), #P ≤ 0.05). Arrowheads denote fibrotic areas, while arrows indicate hemorrhages. The degree of hemorrhage was lower in combination, BDNF, and HO-1-MSCs groups compared with the GFP-MSCs group. Each picture (c) and bar (e) represents four samples per group (n = 4).

