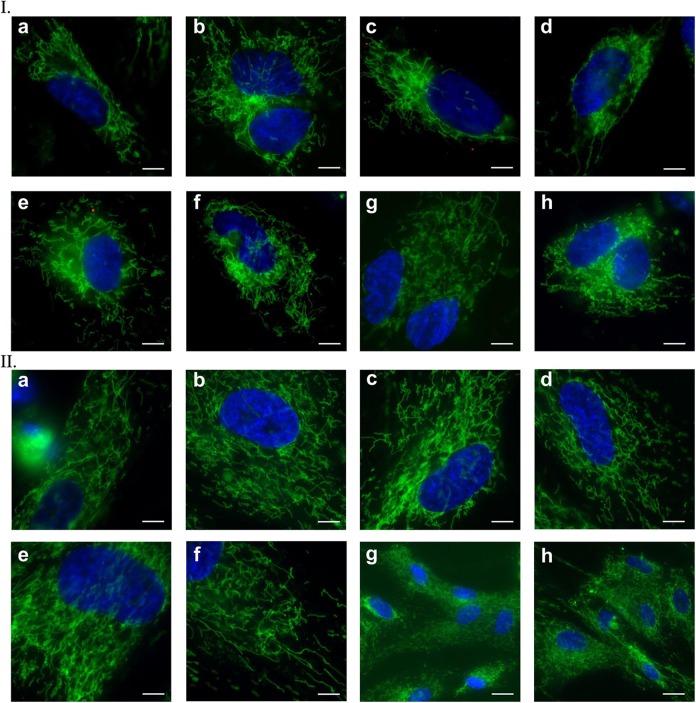
Figure 10.
Mitochondrial staining with MitoTracker Green after days 20 (I) and 40 (II) of cardiomyocyte differentiation in vitro. (a) to (h) Pictures of both analyzed time points refer to selected stained areas of in vitro cell culture. Scale bar: 50 μm and 150 μm for II(g) and II(h) images, respectively.

