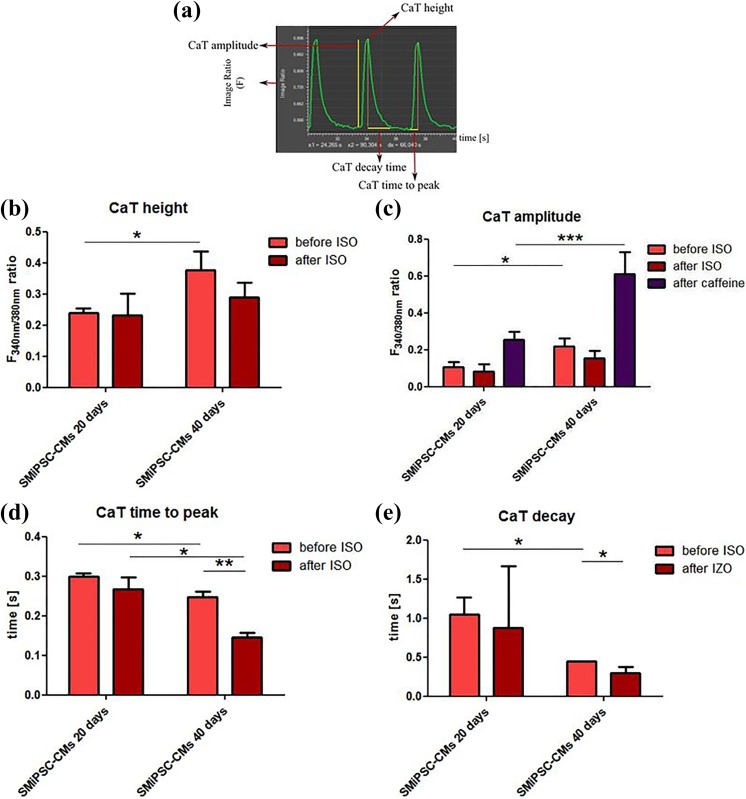
Figure 14.
Parameters of transient calcium turnover in the 194 cell line of SMiPSC-derived cardiomyocytes after 20 and 40 days of cell differentiation in vitro. (a) Demonstration of calcium parameters: CaT height is the maximum value of the F340 nm/F380 nm ratio at which Ca2+ triggers cell contraction. At this point, the calcium quantity in the cytoplasm reaches the highest level, and on the graph, the CaT height is denominated in a peak point; the CaT amplitude of the F1/F0 ratio refers to the magnitude of fluorescence changes from diastole (calcium residing in SR stores) until systole (triggered by calcium ions released to the cytoplasm); CaT time to peak is the time to reach the maximal F1/F0 ratio after Ca2+ release from the SR; CaT decay is the time needed to take up Ca2+ from the cytoplasm prior to diastole. (b) Average height of the fluorescence signal (F340nm/F380 nm ratio) refers to the intracellular calcium pool during contraction and before and after isoproterenol (ISO) administration. (c) Amplitude of fluorescence changes during SMiPSC-CM contraction, before and after isoproterenol administration and after caffeine treatment (activating RyR receptor and preventing Ca ion uptake into SR stores). (d) Time-to-peak F340nm/F380 nm ratio shortening before and after ISO addition. (e) The time of calcium decay before and after isoproterenol administration. The calcium measurements were taken in three cell culture areas, and the mean values originated from five repeats for each area examined.

