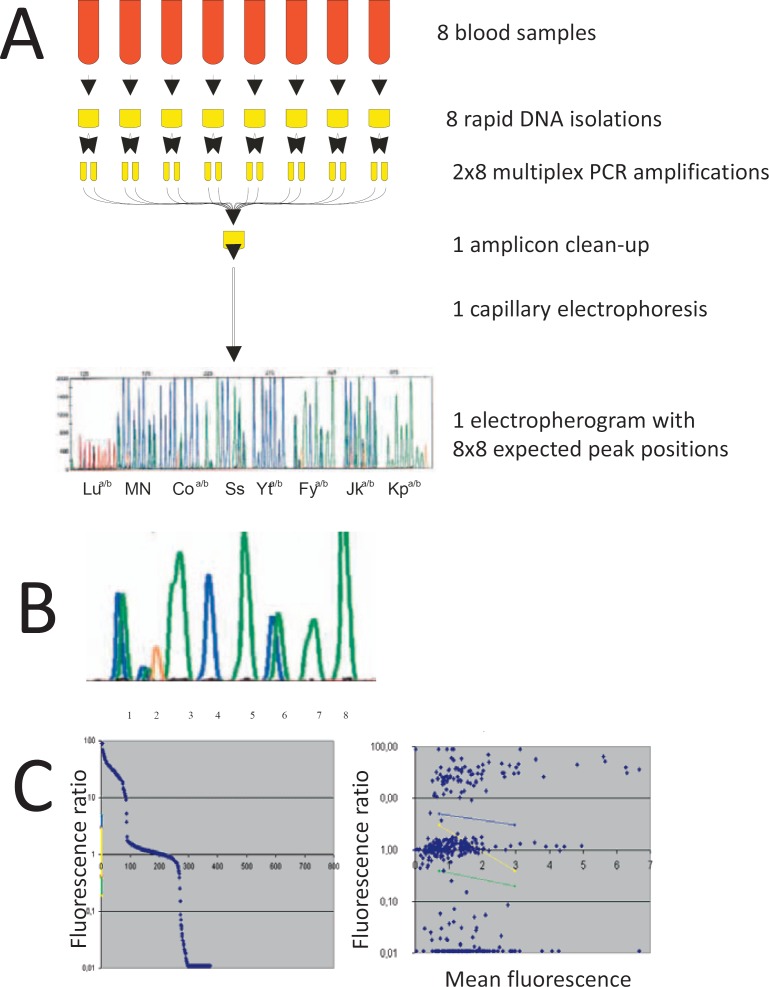
Fig. 1.
Outline of the workflow. Panel A Schematic workflow of the pooled capillary electrophoresis: From eight donors, a crude DNA preparation was prepared using Extract-N-Amp system. For each sample, two multiplex PCR were performed, eight different variants of the multiplex PCR were used that yielded slightly different product sizes. PCR amplicons of these 2 × 8 multiplex PCR were pooled and analyzed by capillary electrophoresis. Panel B For each sample and polymorphism, a specific product size was expected that could show fluorescence for one, the other or both alleles. The fluorescence ratio of the two allele-specific colors was analyzed. Panel C Visualization of the fluorescence ration distribution (left panel) and the fluorescence ratio versus mean fluorescence (right panel) allowed to define the regions for heterozygosity (yellow), and borderline results (blue and green) used for the automated analysis of the fluorescence ratio.

