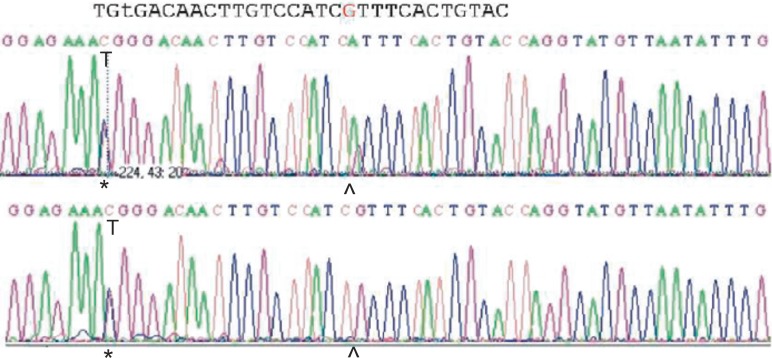
Fig. 2.
Molecular basis of a false-negative antigen S prediction in the Mit allele. The electropherogram of the Mit+ sample (upper sequence) and a control Ss sample (lower sequence) is shown in a region encompassing the primer binding site. The asterisks indicate the 143C/T polymorphism discriminating S and s, the caret the 161G/A polymorphism characterizing the Mit allele. The A of the Mit allele introduces an additional mismatch of the primer which likely prevents efficient primer binding.

