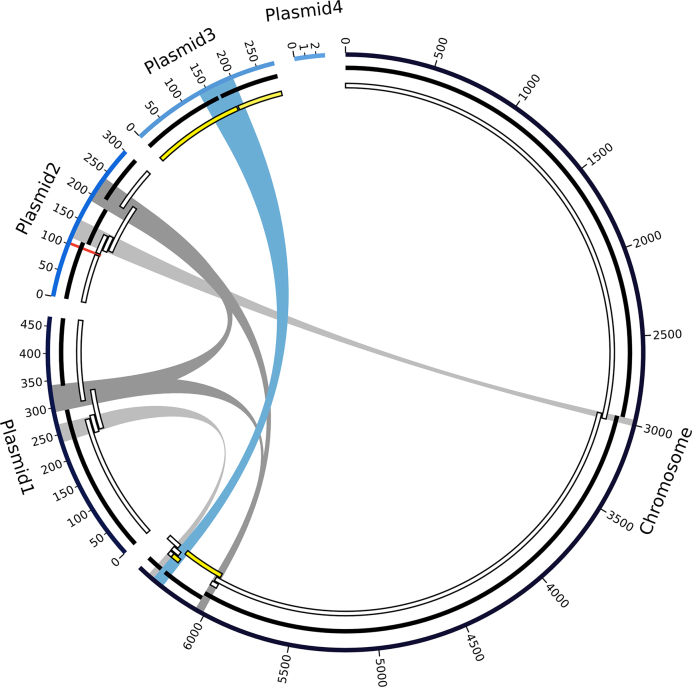
Figure 3.
Graph of the final high-quality P. koreensis P19E3 genome assembly. For display, the five circular elements (one chromosome, 4 plasmids) were linearized and not drawn to scale. Going from outward to inward circles: 1) ONT data assembly using Flye, 2) PacBio data assembled with Flye and 3) PacBio data assembled with HGAP3 are shown. Repeats above 30 kb are shown in the center (blue and gray bands, blue showing the longest repeat), which are also listed in Table 4; they coincide with areas where the PacBio-based assemblies were fragmented. A genomic region identified as a structural variation (ca. 5 kb) is also shown (red mark on plasmid 2). For the HGAP3 assembly with PacBio reads (innermost circle), regions are marked (in yellow) which, due to an assembly error, mapped to both chromosome and plasmid; Flye was able to resolve this region. Since plasmid 4 did not get assembled with the long read technologies, due to its short size, there is no PacBio counterpart in the PacBio tracks.

