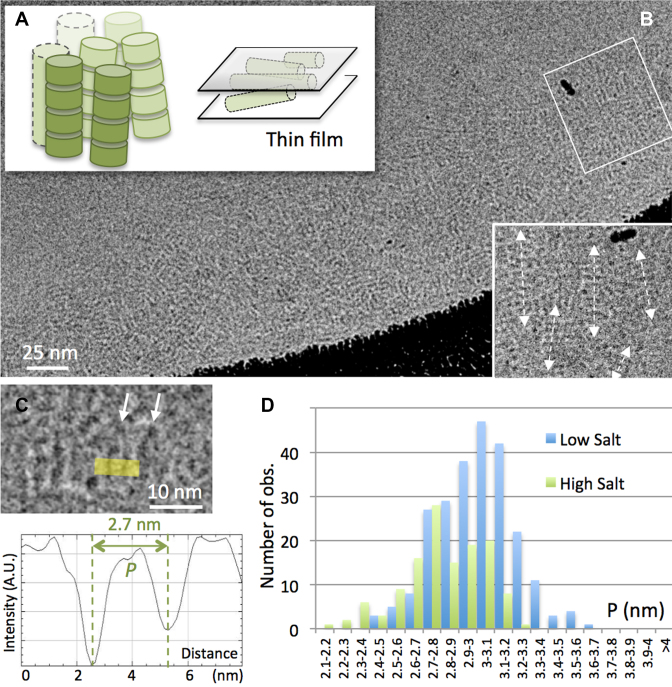
Figure 2.
CryoEM of NCP forming columnar phases in high salt solution and comparison of P-values measured in low versus high salt conditions. (A) The columnar phase formed in high salt (160 mM [+]) is trapped within a thin film and observed by cryoEM in (B). Columns align parallel to the film and superimpose within its thickness, leading to complex striated patterns. A local nematic order is observed in an enlargement (white rectangle). (C) Side view nucleosomes are recognized locally and P is measured on line profiles. (D) Comparison of the distributions of P-values recorded in the columnar hexagonal phase (160mM [+], green) and in the lamello-columnar phase (15 mM [+], blue, see Figure 1).

