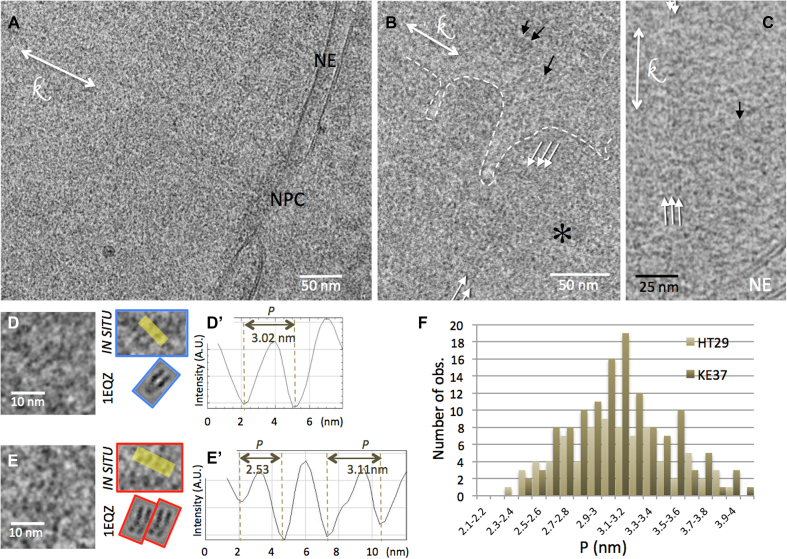
Figure 3.
CEMOVIS of interphase nuclei of the human cell lines KE37 (A, B and D) and HT29 (C and E). (A) Local view of a nucleus limited by the NE. An NPC is visible. (B) A chromatin-dense region (*), delineated by the white dotted line, coexists with a less dense region. (B and C) Striations are visible, either locally (black arrows) or extending over longer distances (white arrows). (D and E) Nucleosomes visualized in side views. The patterns are compared with CTF-modulated projections of the crystallographic structure of the particle (from PDB ID: 1 EQZ). (D’ and E’) The distance between the DNA gyres P, is measured on line profiles indicated in yellow in (D) and (E). (F) Distribution of P for the two cell types.

