Figure 5.
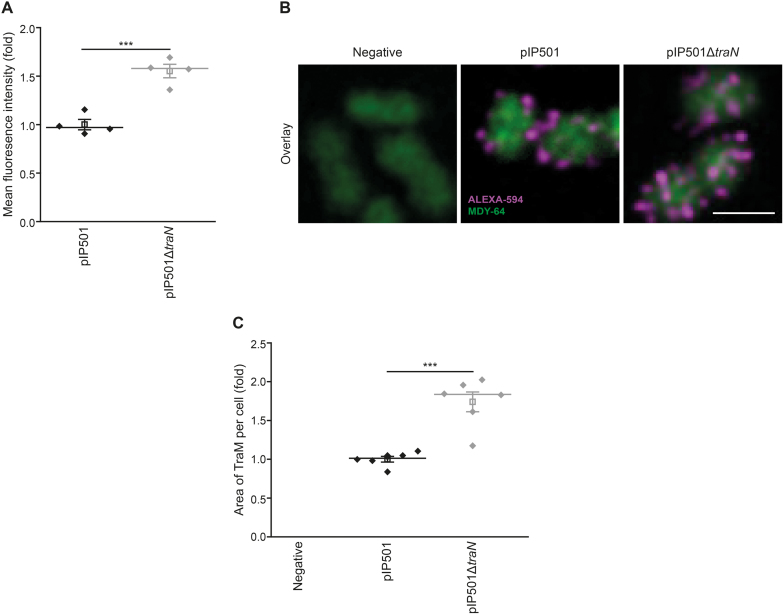
A significant quantity of overproduced TraM localizes to the cell periphery in the E. faecalis traN deletion mutant. (A) Flow cytometric analysis of E. faecalis JH2-2 wild type (pIP501) and mutant (pIP501ΔtraN) cells to analyze TraM signal intensities with E. faecalis JH2-2 as negative control. Fixed cells were probed with primary TraM-antibodies and corresponding secondary antibodies conjugated with Alexa-594. 30,000 cells per sample were analyzed in quadruplicate with flow cytometry. The signal of the negative strain was subtracted from the TraM-signal of wild type and knockout strain as a background control. The mean fluorescence intensity of the TraM signal is depicted as fold of wild type. n = 4. For quantification of TraM fluorescence signal intensity using confocal microscopy techniques, see Supplementary Figure S5A, B. (B, C) Immunolabeling of E. faecalis JH2-2 wild type (pIP501) and the mutant strain E. faecalis JH2-2 (pIP501ΔtraN) with E. faecalis JH2-2 as negative control to analyze TraM signal area. Cells were prepared as described in (A). Z-projection of three-dimensional representative micrographs (B) and quantification of the area of TraM spots (C) are displayed. Values are given as fold of the wild type. No fraction area of the negative strain was detectable. Six independent measurements (n = 6) with 527 (negative), 317 (pIP501) and 306 (pIP501ΔtraN) cells in total were analyzed. Scale bar represents 2 μm. Mean (square) and median (center line) are depicted. For dot plots standard error of mean (s.e.m.) is given. ***P< 0.001.

