Figure 3.
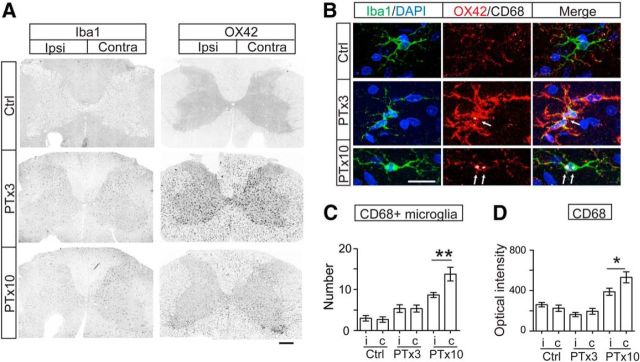
Microglia activated in response to unilateral PTx. A, Overview of Iba-1- and OX42-labeled microglial cell expression in the spinal cord of control, PTx3, and PTx10 animals. Note the much higher OX42, but not Iba-1, intensity in the affected dorsal column at both 3 and 10 d after injury. B, Images of individual Iba-1+ microglial cells showing increased OX42 and CD68 intensity after PTx. Arrows point to CD68+ clusters within microglial cells. C, Numbers of CD68+ microglia in medial IZ. **p = 0.005, n = 6–8 sections. D, Optical intensity of CD68+ clusters in microglia. *p = 0.0229, n = 16–22 cells. Mann–Whitney U test for within-group comparison. Scale bars: A, 0.2 mm; B, 10 μm. See Table 1 for mean ± SEM values and Figure 3-1, for raw data. For all other statistical values, see Table 2.

