
Figure 8.
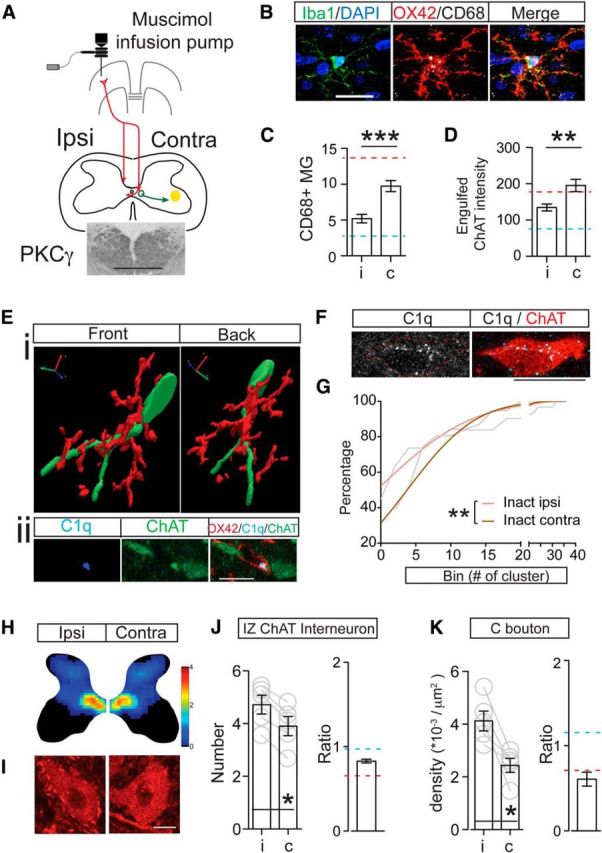
Unilateral motor cortical inactivation induced phagocytic microglial activation, increased neuronal C1q expression, and downregulated the premotor cholinergic innervation. A, Schematic figure showing the method for chronic infusion of the GABAA receptor agonist muscimol into the motor cortex using an implanted osmotic pump and intracortical cannula. Inset image shows symmetric PKCγ staining in the dorsal columns bilaterally, indicating no axon loss due to cortical inactivation. B, Images of individual Iba-1+ microglia showing increased OX42 and CD68 intensity after cortical inactivation. C, D, Numbers of CD68+ phagocytic microglia and optical intensity of engulfed ChAT clusters in microglial cells increased in medial IZ in animals receiving motor cortex inactivation. Mann–Whitney U test, **p < 0.01, ***p < 0.001. n = 10–11 sections for C, n = 30–33 cells for D. E, 3D reconstruction shows wrapping of a cholinergic IN by a microglial cell (Ei). Single optical images in Eii indicate ongoing engulfment as shown by the presence of a C1q+/ChAT+ cluster in the microglial cell that is contacting the neuron. F, Representative images showing increased C1q expression in a cholinergic IN. G, Cumulative distribution curves of C1q cluster numbers within cholinergic INs showing a significant rightward shift in cluster number on the inactivated side. Gray lines are original curves and colored lines are after fitting to a cumulative Gaussian frequency distribution (two-way ANOVA, **p < 0.01, n = 31–37). H, J, Density heat map and cell counts of cholinergic INs in the spinal cord medial IZ in muscimol inactivation animals showing a significant decrease. The color scale represents 0–4 cells/104 μm2. I, K, C bouton density also showed a significant contralateral loss after inactivation. Contralateral to ipsilateral ratios are much lower than those of control. Wilcoxon matched-pairs test, p = 0.0313, n = 5. The red dotted line indicates the mean value of PTx10 animals and the blue dotted line indicates the mean value of controls. Scale bars: A:, 0.2 mm; B, Eii, F, 10 μm; I, 20 μm. See Table 1 for mean ± SEM and Figure 8-1, for raw data. For all other statistical values, see Table 2.