Figure 5.
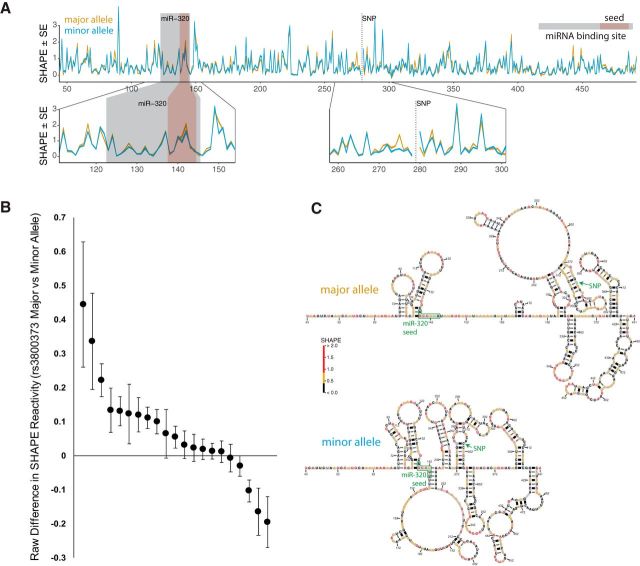
The rs3800373 affects the RNA secondary structure of the FKBP5 3′UTR. A, Top, SHAPE data for a ∼500 nt region of the FKBP5 3′UTR encompassing rs3800373 and the miR-320-binding site. Gold, Major (protective) allele; blue, minor (risk) allele; gray box, miR-320a-binding site; red box, miR-320a seed site; dotted line, position of rs3800373. RNA SHAPE reactivities indicate widespread structural differences throughout the assayed FKBP5 3′UTR transcript based on the allele at rs3800373. Bottom, Magnified SHAPE reactivity plots for the miR-320a-binding site. SHAPE reactivity is slightly higher for the major allele in the miR-320a seed site (left), indicating reduced base pairing. The thickness of the lines indicates the SE on the measurements of reactivity. B, Raw difference in SHAPE reactivity data from A for the 21 individual nucleotides (black dots) in the miR-320a-binding region. These values were computed by comparing SHAPE reactivity data in the major allele structure versus SHAPE reactivity data in the minor allele structure. Higher SHAPE reactivity values indicate a greater degree of accessibility (i.e., less base pairing). Therefore, nucleotides with a more open structure in the context of the major allele (n = 16) are represented by positive values, and nucleotides with a more open structure in the context of the minor allele are represented by negative values (n = 5). Raw differences are shown along with confidence intervals based on four separate assessments of SHAPE reactivity in this genomic region. C, SHAPE-informed minimum free energy structures for the rs3800373 major (top) and minor (bottom) alleles, with SNP and miR-320a seed sites annotated. Nucleotide colors represent measured SHAPE reactivity as indicated by the color bar.

