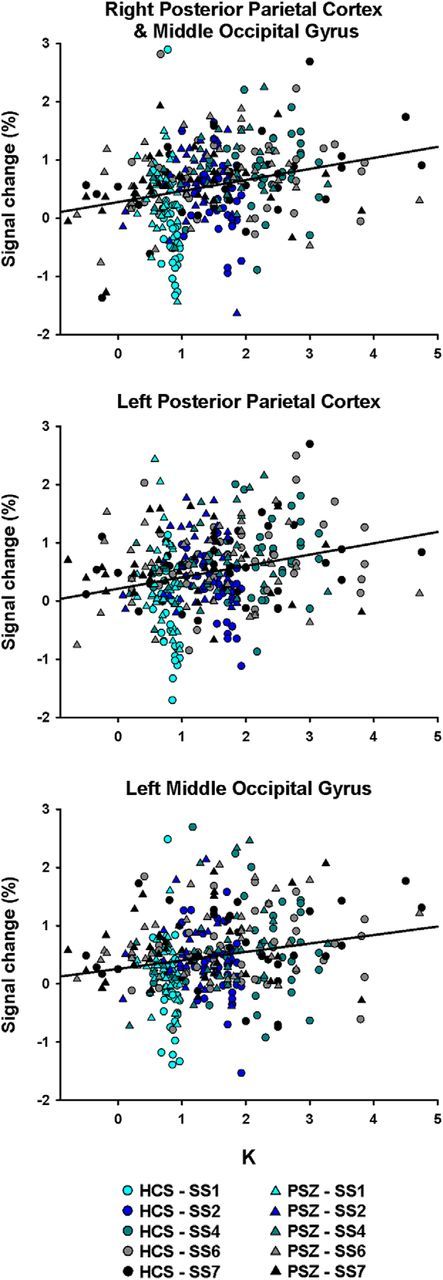
Figure 4.

K-dependent activation change. Scatter plots represent the relationship between K and activation in the three clusters displayed in Figure 3 and listed in Table 2. Each healthy control subject (HCS; circle) and each participant with schizophrenia (PSZ; triangles) contribute five data points to each graph, one at each set size.
