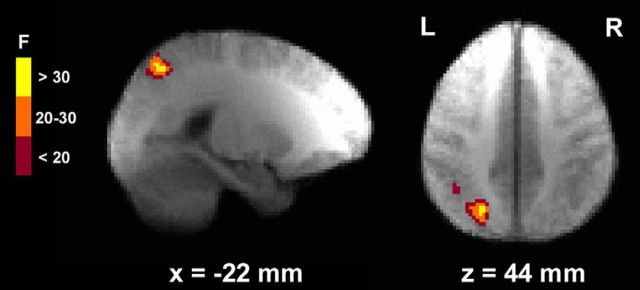
Figure 5.
Region identified by the K × group interaction regressor. The left posterior parietal cortex (PPC) region shown here displays differential K-dependent signal change in healthy control subjects versus participants with schizophrenia. Group activation maps are overlaid onto anatomical scans in Talairach space, averaged over all participants.

