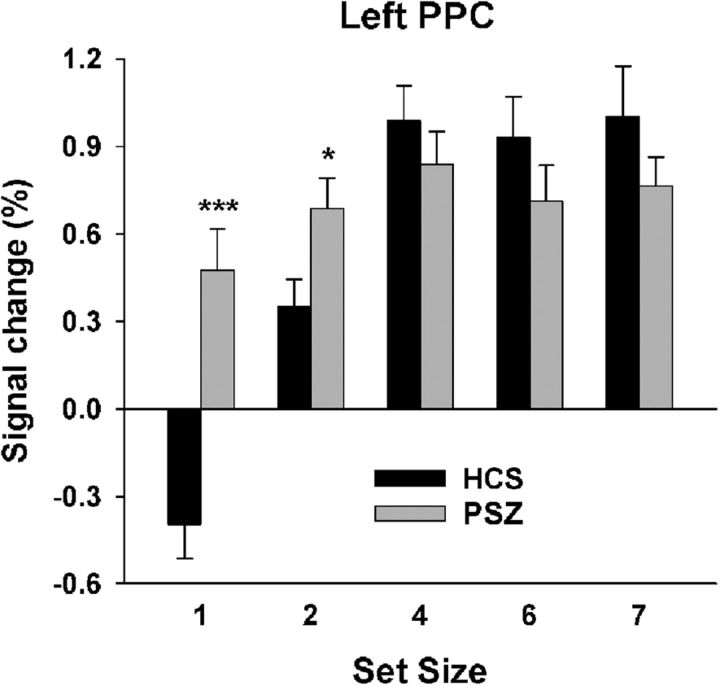
Figure 7.
Left posterior parietal cortex (PPC) activation by set size. Average (±SEM) BOLD activity at each set size in the region displaying a K × group interaction (Fig. 5; Table 3) for healthy control subjects (HCS) and participants with schizophrenia (PSZ). Independent-samples t test comparing HCS and PSZ: *p < 0.05; ***p < 0.001.

