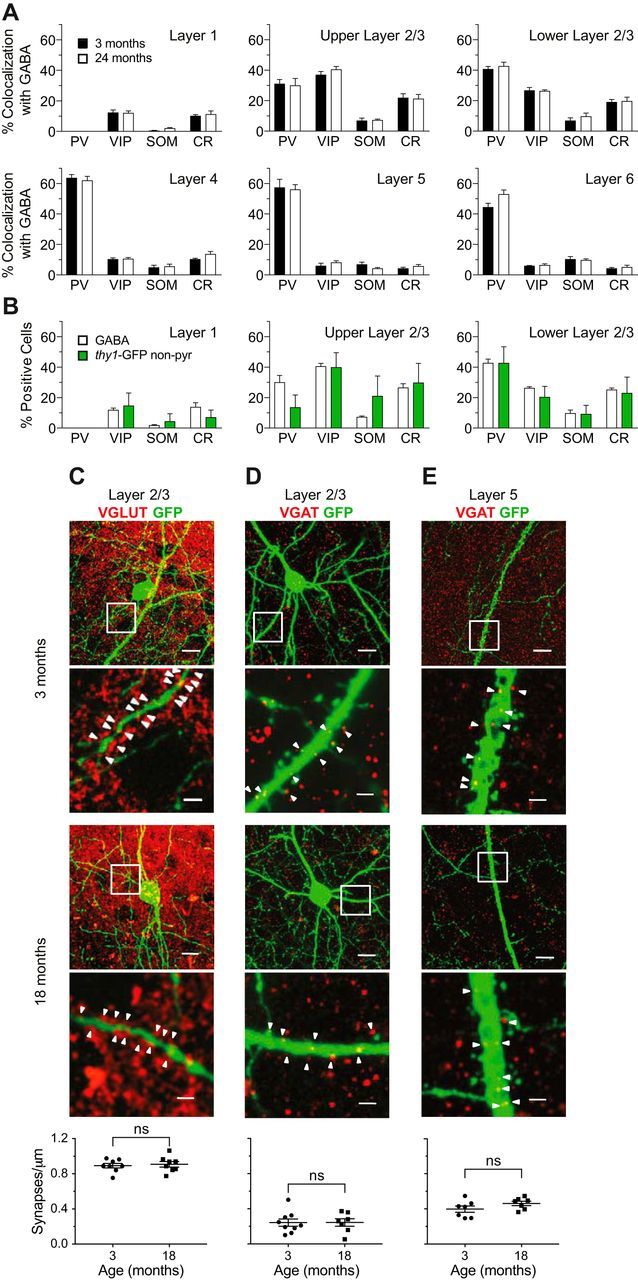
Figure 3.

Interneuron subtype representation in layers of mouse visual cortex. A, Plots showing colocalization of GABA with: PV, VIP, SOM, and CR subtype markers in layers of visual cortex in young adult (3 months) or aged (24 months). A total of 25669 GABA-positive cells were counted. For each subtype in each layer, the percentage at 3 and 24 months was compared using a two-tailed Student's t test. Holm–Sidak's method with α = 0.05 was used to correct for multiple comparisons. The relative representation of interneuron subtypes within different cortical layers was largely unchanged in aged compared with young mice (p = 0.044 for SOM in layer 1, p = 0.69 for SOM in layer 5, p = 0.84 for PV in layer 6, and p > 0.99 for all other subtypes across layers, n = 3–5 mice for 3 months and 3–6 mice for 4 months). B, Interneuron subtype representation in the thy1-GFP-labeled nonpyramidal cells in the superficial layers of visual cortex in aged mice compared with subtype representation in the GABA-positive population in the same layers. For the GABA-positive group, the same data were used as in A. A total of 399 GFP nonpyramidal cells and 5262 GABA-positive cells were examined. For each subtype in each layer, the percentage GABA-positive and GFP-nonpyramidal was compared using a two-tailed Student's t test. Holm–Sidak's method with α = 0.05 was used to correct for multiple comparisons. Representation of the subtypes was not different between GABA-positive and GFP-nonpyramidal cells (p = 0.95 for PV in upper layer 2/3, p = 0.98 for CR in layer 1, and p > 0.99 for all other subtypes across layers, n = 3 mice for the GABA-positive cells and 6–8 for the GFP-nonpyramidal cells). C, Representative images of excitatory synapses (VGLUT) on L2/3 interneuron dendrites (GFP), at 3 months (top 2 panels) and 18 months (middle 2 panels). The second and fourth panels are enlargements of the boxed regions marked in the first and third panels, respectively. Synapse densities are quantified in the bottom panel. Each data point represents one animal. There is no statistically significant difference between the two ages (p = 0.69, unpaired two-tailed Student's t test, n = 8). D, Same as in C, except inhibitory synapses (VGAT) on L2/3 pyramidal neuron basal dendrites (GFP). There is no statistically significant difference between the two ages (p = 0.99, unpaired two-tailed Student's t test, n = 7–9). E, Same as in C, except inhibitory synapses (VGAT) on L5 pyramidal neuron apical dendrites (GFP). There is no statistically significant difference between the two ages (p = 0.17, unpaired two-tailed Student's t test, n = 7). Scale bars: first and third panels, 10 μm; second and fourth panels, 2 μm. All error bars represent SEM.
