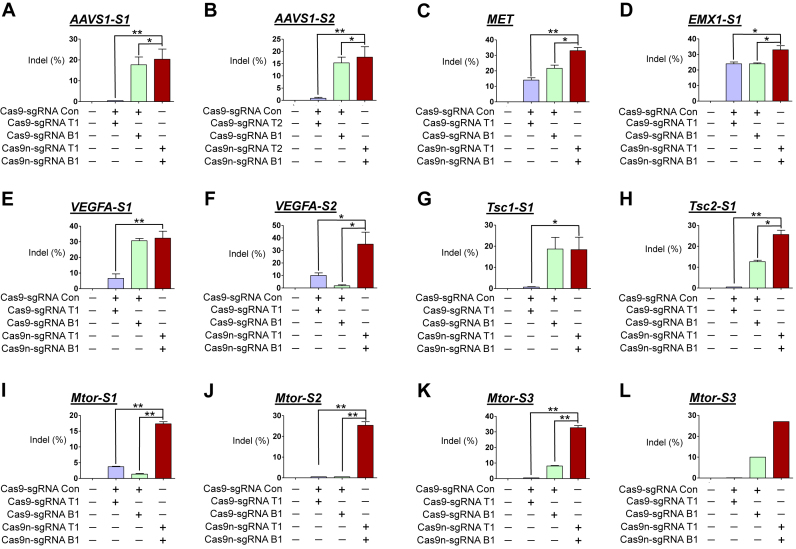
Figure 1.
Gene disruption efficiencies of paired D10A Cas9 nickases vs. Cas9 nucleases using sgRNA (5′GGX20) and control sgRNA in human and mouse cells. HEK293T were analyzed 3 days after transfection with plasmids encoding paired Cas9 nickases or Cas9 nuclease, sgRNAs targeting AAVS1-S1 (T1 and B1; A), AAVS1-S2 (T2 and B1; B), MET (T1 and B1; C), EMX1-S1 (T1 and B1; D), VEGFA-S1 (T1 and B1; E), VEGFA-S2 (T1 and B1; F). NIH3T3 were analyzed 3 days after transfection with plasmids encoding paired Cas9 nickases or Cas9 nuclease, sgRNAs targeting Tsc1-S1 (T1 and B1; G), Tsc2-S1 (T1 and B1; H), Mtor-S1 (T1 and B1; I), Mtor-S2 (T1 and B1; J), Mtor-S3 (T1 and B1; K) and fluorescent proteins (i.e., eGFP or mCherry). A sgRNA that does not target the respective genes was used as a control and is designated as Con. The frequency of Cas9 nuclease- or paired nickases-driven mutations as determined by the T7E1 assay are shown using bar graph. Error bars were derived from three independent experiments (n = 3). For brevity, statistical significance was shown only for comparison between a group-of-interest and the paired nickase group, except for the negative control group; *P< 0.05, **P< 0.01 by paired t-test. (L) Cas9 nuclease- or paired nickase- driven indels determined by the deep sequencing.

