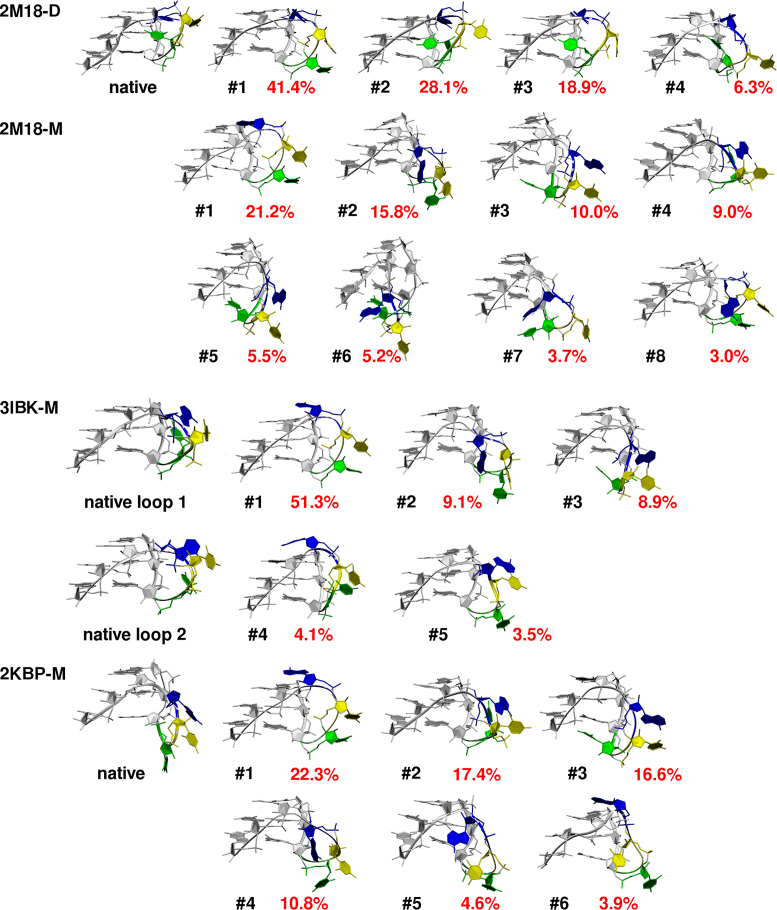
Figure 4.
Experimental structures of UUA propeller loops and centroids of clusters with more than 3% population in MD simulations of 2M18-D, 2M18-M, 3IBK-M and 2KBP-M systems. Only the loop and two adjacent G3 stretches are shown. First uracil of the loop is green, second uracil yellow and adenine is blue. The black number shows cluster number and the red number is the cluster population. See also Figure 3 and Supplementary Figure S3 for cluster development in the course of the simulations.

