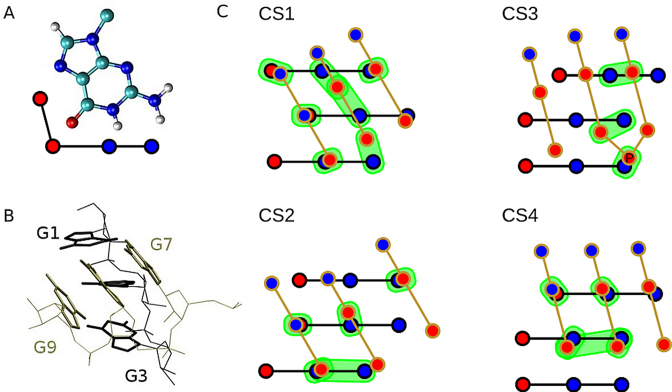
Figure 5.
3D and schematic representations of selected members of the CS ensemble. (A) guanine with its hydrogen bond donor (blue) and acceptor (red) groups highlighted in a simplified scheme; (B) 3D structure of the dominant CS variant CS1; (C) schematic representation of variants CS1–CS4 of CSs; blue/red circles represent H-bond donor/acceptor groups; interacting pairs are in green background; the inclined G7–G9 strand is in front. The scheme is not a projection of 3D structure onto the plane, i.e. it is rather a sketch than an attempt to precisely describe the 3D structures. PDB files with atomic coordinates of CS1–CS4 are available as Supplementary files.

