Figure 6.
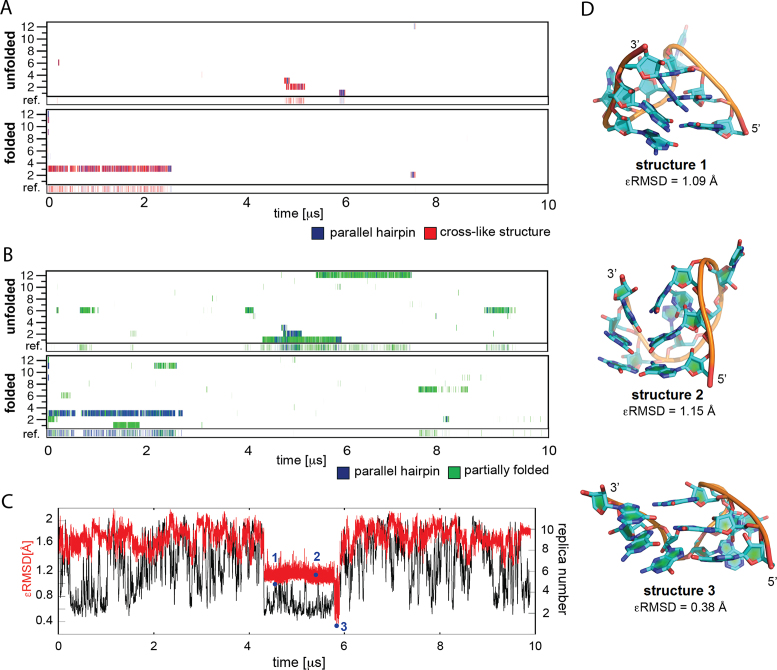
Native and intermediate states in REST2 simulations of rGGGUUAGGG. (A) Occurrence of native PH and cross-like structures detected via ϵRMSD development with respect to the native PH structure and the four cross-like structures shown in Figure 5 (they are considered as a single CS ensemble in this figure). The twelve continuous (demultiplexed) trajectories and the reference replica (see Materials and Methods) are shown; the reference replica is at the bottom of the graph. Note that the twelve continuous replicas have equal significance and their numbering is incidental. REST2 from unfolded and folded states are at the top and bottom, respectively. (B) Occurrence of PH and partially folded structures detected based on the number of native H-bonds for the continuous trajectories and the reference replica. Note (cf. A and B) that the ϵRMSD metrics is more conservative than the native H-bond metrics. (C) ϵRMSD development (red) and position in the replica ladder (black) of the continuous trajectory (trajectory 1 in the ‘unfolded’ REST2 simulation in panels A and B containing the PH folding event occurring shortly before 6 μs; the data is averaged over 1 ns windows. The black curve showing position of the trajectory in the replica ladder looks continuous because of the averaging. (D) Structures identified at selected points during the folding event in panel C.

