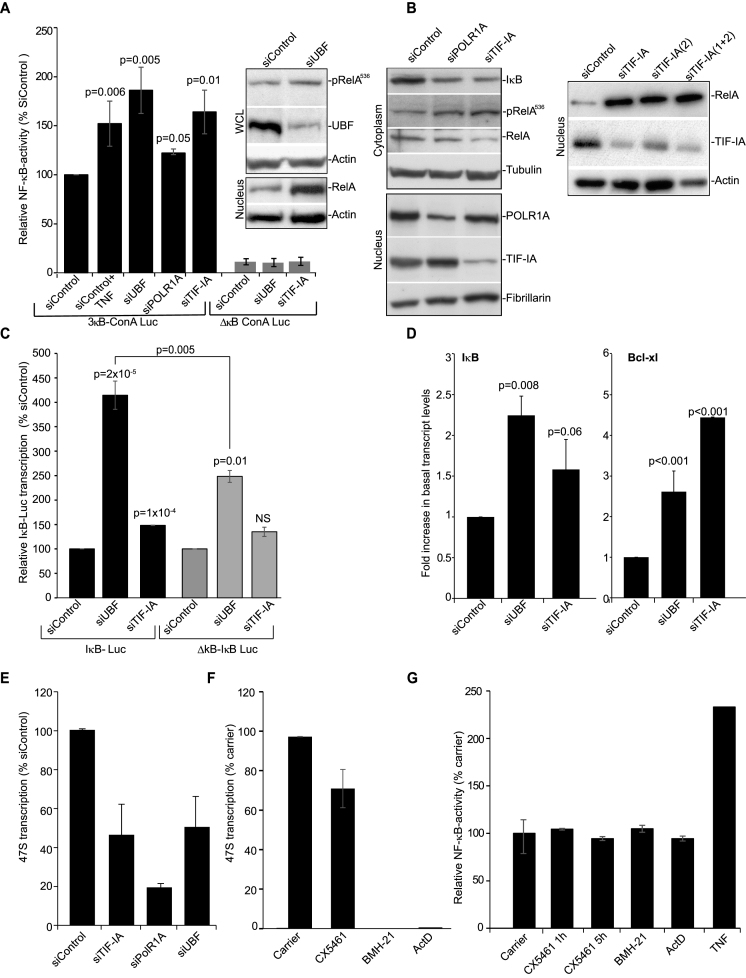
Figure 1.
Silencing PolI complex components stimulates the NF-κB pathway. (A–C and E) SW480 cells were transfected with the indicated siRNA species. (A) Cells were co-transfected with pCMVβ and either a wild-type NF-κB-dependent luciferase reporter construct (3× κB ConA) or an equivalent plasmid with κB sites deleted (ConAΔκB). TNF (10 ng/ml, 4 h) acts as a control NF-κB stimulant. Luciferase activity was normalized using β-galactosidase activity. Results are presented as the percentage of relative NF-κB activity compared to cells transfected with 3× κB ConA-Luc/control siRNA (siControl). The mean of at least 3 repeats (±s.e.m.) is shown. Inset: Levels of pRelA536, nuclear RelA and UBF in whole cell (WCL) or nuclear lysates were determined upon UBF silencing using Western blot analysis. Actin acts as a control. (B) Immunoblots demonstrate- Left: reduced cytoplasmic IκBα, increased pRelAS536 and decreased cytoplasmic RelA upon silencing of TIF-IA and POLR1A. Nuclear extracts confirm efficient protein depletion. Right: increased nuclear RelA upon depletion of TIF-IA by two independent siRNAs. α-Tubulin, fibrillarin and actin act as loading controls. (C) Cells were co-transfected with IκB-luc (luciferase driven by full length IκB promoter) or ΔκB-IκB-luc (equivalent in which NF-κB sites are deleted) and pCMVβ. The percentage relative luciferase activity compared to siControl was calculated. Mean ± s.e.m. is shown (N = 3). (D) HCT116 cells were transfected as above. qRT-PCR was performed with primers for the NF-κB target genes IκBα and Bcl-xl. GAPDH was used to normalise. Results are presented as the fold increase in transcript compared to siControl. The mean (± s.e.m.) is shown. N = 3. (E) qRT-PCR with primers for the 47S pre-rRNA transcript measured levels of rRNA transcription. GAPDH was used to normalise. Results are presented as the percentage of relative 47S transcription compared to siControl. The mean (± s.e.m.) is shown. N > 3 (F) SW480 cells were treated with the PolI inhibitors CX5461 (500 nM), BMH-21 (4 uM), ActinomycinD (ActD, 1 ug/ml) or TNF (10 ng/ml), for 5 h. qRT-PCR measured levels of the 47S transcript as above. Mean ± s.e.m. is shown (N = 2). (G) SW480 cells were transfected with 3× κB ConA-Luc and pCMVβ. Twenty-fours hours later they were treated with inhibitors as in F. Graph shows the mean of at least two individual repeats ±s.e.m. P values throughout are compared to the respective control and were derived using a two tailed Student's t test. N values throughout are biological repeats. In (C), the P value for siUBF IκB-Luc versus siUBF ΔκB-IκB-Luc is also given. See Supplemental Figure S1 for additional cell lines and supporting data.

