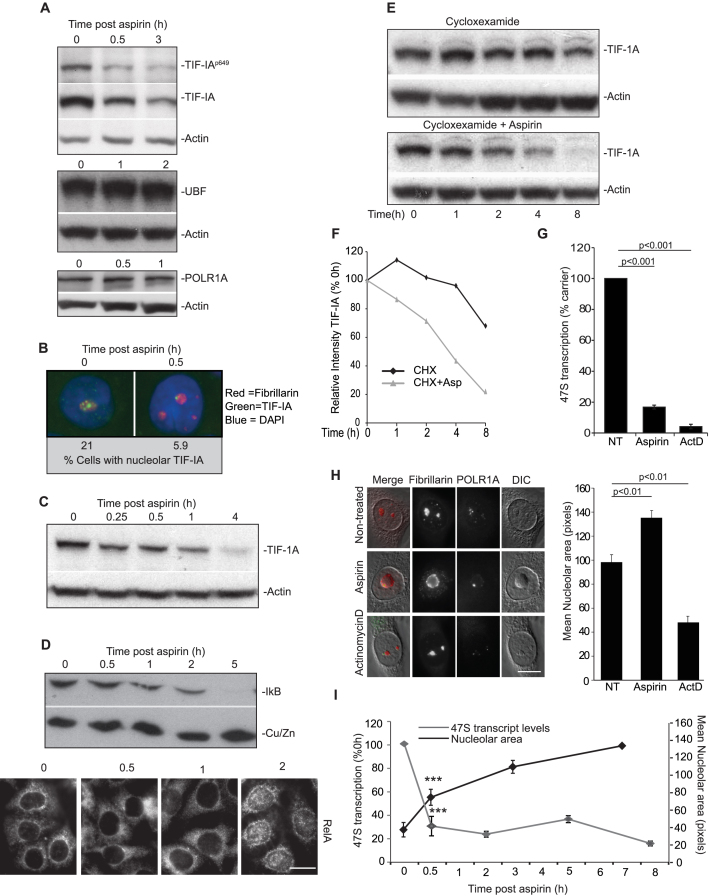
Figure 2.
Degradation of TIF-IA and a distinct nucleolar phenotype precede aspirin effects on the NF-κB pathway. (A–D) Aspirin (used as a model stress stimuli) induces a decrease in total cellular levels of TIF-IA, which precedes degradation of IκB and nuclear accumulation of RelA. SW480 cells were treated with aspirin (10mM) for the indicated times (A, C and D) Immunoblot analysis was performed on WCL with the indicated antibodies. (B) Immunomicrographs (63X) show levels and localisation of native TIF-IA. Below: The percentage of nuclei (as depicted by DAPI stain) with bright puncti of TIF-IA were quantified using ImageJ software. A minimum of 200 nuclei were analysed per experiment from at least 10 fields of view. N = 3. (D) Bottom: Immunomicrographs (×63) demonstrate accumulation of RelA in nuclei 2 h after aspirin exposure. (E and F) SW480 cells were treated with cyclohexamide (10 uM) alone or with aspirin (10 mM) for the times specified. (E) Immunoblot shows cellular levels of TIF-IA. (F) TIF-IA band intensities relative to actin were quantified using ImageJ. Results are presented as the percentage compared to the 0 h control. One representative experiment is shown. N = 2. (G–I) Perturbation of nucleolar structure and function in response to aspirin. (G) rDNA transcription was quantified after aspirin (3 mM, 16 h) or actinocycinD (50 ng/ml, 2 h) treatment using qRT-PCR for the 47S transcript as above. Results are presented as the percentage of relative transcription compared to non-treated (NT) control. The mean (±s.e.m.) is shown. N = 4. (H) Representative DIC immunomicrographs (x63) showing the cellular localisation of components of the tripartite nucleolar structure in response to aspirin (10 mM, 8 h) and actinomycinD (50 ng/ml). Fibrillarin marks the dense fibrillar component and POLR1A the PolI complex in the fibrillar centre. Nucleolar area was quantified using ImageJ and fibrillarin staining (to define nucleoli). At least 250 cells were analysed per experiment. Graph depicts the mean (±s.e.m.) of three experiments. (I) rDNA transcription and nucleolar size were monitored over time in SW480 cells using qRT-PCR for the 47S transcript (as above) and ImageJ analysis of area devoid of DAPI staining (as a marker for nucleoli). At least 200 cells from 10 fields of view were analysed for nucleolar area. Graph depicts the mean of three experiments (±s.e.m). ***P < 0.001. Actin and Cu/ZnSOD act as loading controls throughout. Scale bars = 10 μm. P values throughout are compared to the respective control and were derived using a two tailed Student's t test. N values are biological repeats. See Supplemental Figure S2 for additional cell lines and supporting data.

