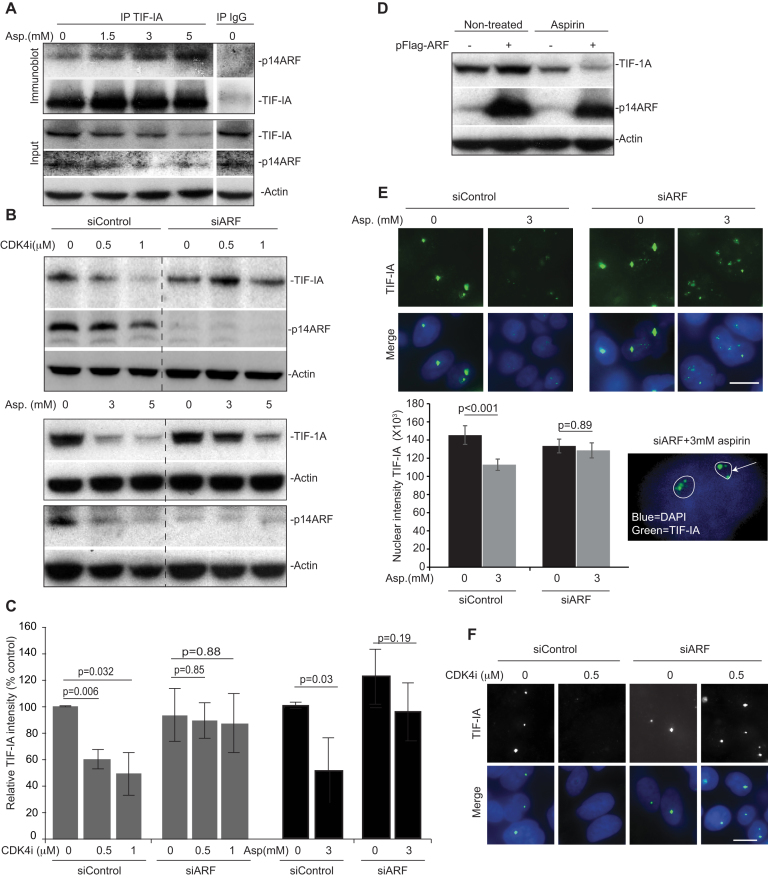
Figure 5.
Identification of a role for p14ARF in TIF-IA degradation. (A) TIF-IA interacts with p14ARF in response to aspirin. SW480 cells were treated with 0–5 mM aspirin for 16 h. Immunoprecipitation was carried out on WCL using antibodies to TIF-IA and IgG control. Precipitated proteins were subjected to western blot analysis with the indicated antibodies. Input levels are shown. (B–F) Silencing of P14ARF is required for stress-mediated degradation of TIF-IA. (B, C, E and F) SW480 cells were transfected with control or p14ARF siRNA (siARF) then treated for 16 h with CDK4i (0–1 μM) or aspirin (0–3 mM). (B) Immunoblot analysis was performed on WCL with the indicated antibodies. (C) TIF-IA levels relative to actin were quantified using ImageJ analysis. Graph shows the mean (±s.e.m.) compared to non-treated, siControl. N = 3. (E and F) Immunomicrographs (×63) show the levels and localisation of TIF-IA in fixed cells. (E) IPlab software quantified nuclear (as depicted by DAPI staining) intensity of TIF-IA. Data are the mean (±s.e.m.) of >150 nuclei. N = 3. Inset shows nucleolar (outlined) TIF-A in p14ARF transfected cells treated with aspirin. (D) SW480 cells were transfected with pcDNA3 control plasmid (–) or pcDNA3-p14ARF (+) then either non-treated or treated with aspirin (3 mM, 16 h). Immmunoblot was performed on WCL with the indicated antibodies. Actin acts as a loading control throughout. Scale bar = 10 μm. N values are biological repeats. P values were derived using a two-tailed Student's t test. See also supporting Supplemental Figure S4.

