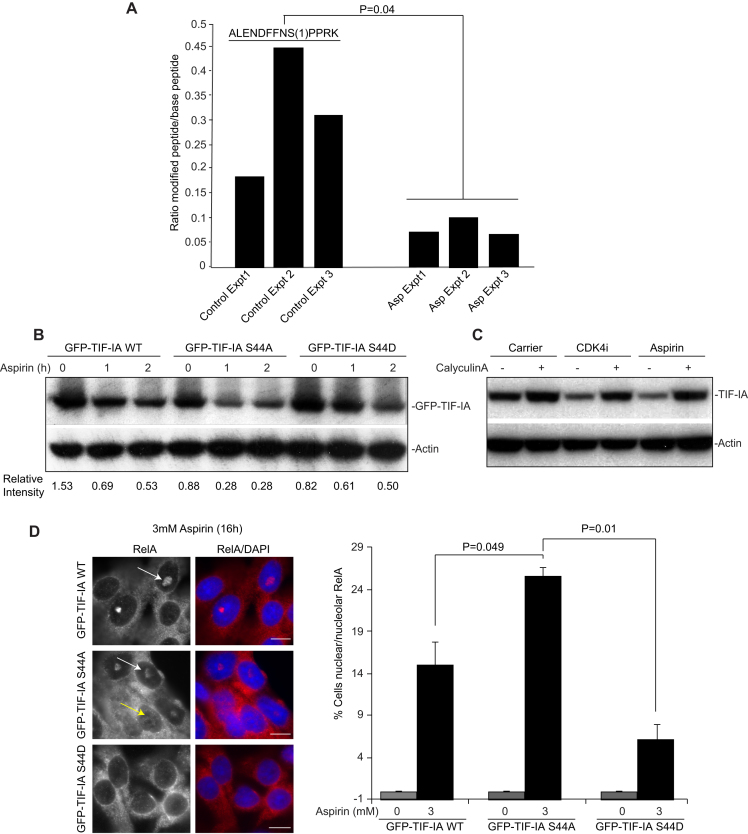
Figure 8.
Dephosphorylation at S44 is critical for stress-mediated TIF-IA degradation and activation of the NF-κB pathway. (A) Label-free quantitative mass spectrometry (MaxLFQ), performed on immunoprecipitated endogenous protein, was used to screen for changes in TIF-IA phosphorylation in response to aspirin (0 or 10 mM, 2 h). Bar graph represents the ratio of phosphorylated to de-phosphorylated peptide in the presence and absence of aspirin, for three independent experiments. The peptide is shown, with the localisation of the phosphorylation site in brackets. (B) SW480 cells were transfected with the indicated GFP-TIF-IA mutants then treated with aspirin (0 or 10 mM) for the times specified. Immunoblots were performed on WCL with the indicated antibodies. The intensity of TIF-IA relative to actin is shown for one representative experiment (N = 3). (C) SW480 cells were pre-treated with CalyculinA (5 nM) for 4 h prior to aspirin (10 mM) or CDK4i (4 μM) exposure (4 h). Immunoblots were performed on WCL with the indicated antibodies. (D) SW480 cells were transfected with the indicated GFP-tagged plasmids then treated with aspirin (0 or 3 mM, 16 h). (Left) Immunomicrographs (×63) demonstrate the localisation of RelA in aspirin treated cell populations. DAPI staining depicts nuclei. (Right) The percentage of cells in the population showing nuclear (yellow arrow) or nucleolar (white arrow) RelA was quantified manually. Data are the mean of at least five fields of view (>150 cells), for two independent experiments (±s.e.m.). Bars, 10 μm. P values were derived as above.

