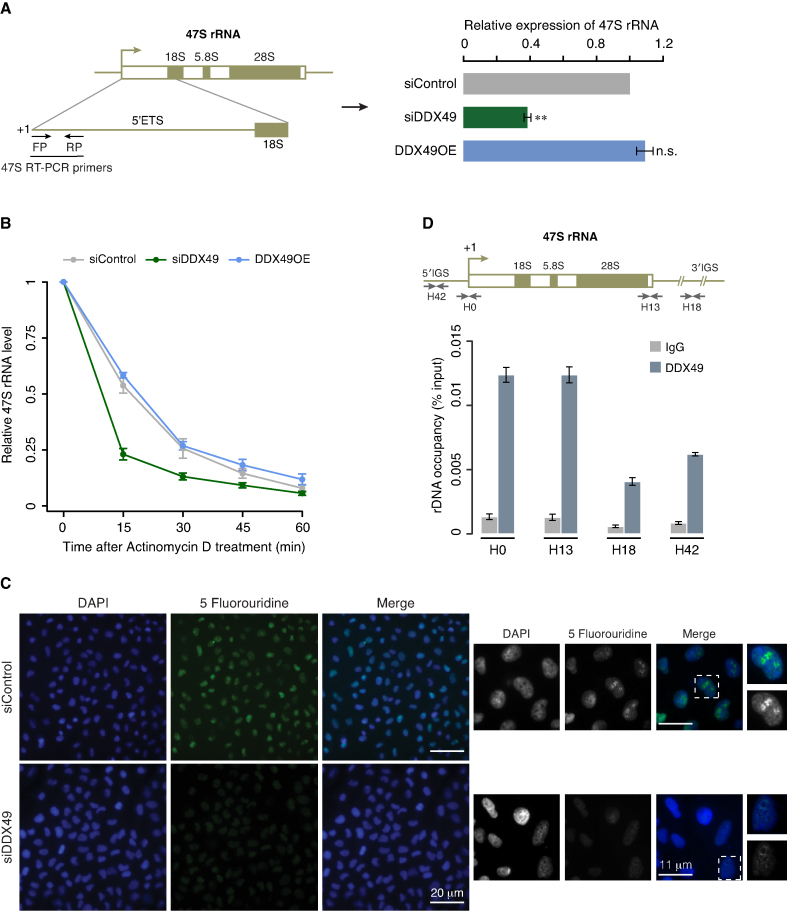
Figure 4.
DDX49 is essential for maintaining steady state levels of pre-ribosomal RNA. (A) DDX49 is essential for maintaining steady state levels of pre-ribosomal RNA. The schema on the left depicts 47S rRNA gene architecture and the positions of the primers that were used in the quantification of 47S rRNA levels. Quantitative RT-PCR analysis of the pre-ribosomal 47S rRNA levels in control (scrambled siRNA), DDX49 overexpression and DDX49 knockdown cells (right panel). The 47S rRNA levels were normalized to GAPDH expression and are presented relative to the control sample. Data are represented as mean of three independent experiments, with error bars representing standard deviations. Statistical significance of differences in distribution between siControl and siDDX49 or DDX49OE was assessed by two tailed t-test. ** indicates P < 0.01; n.s. stands for not significant. (B) Effect of the DDX49 perturbation on the stability of pre-ribosomal rRNA. Quantitative RT-PCR analysis of the pre-ribosomal 47S rRNA levels in control siRNA or DDX49 overexpression or DDX49 knockdown cells, which were treated with actinomycin D and harvested at the indicated time points after the addition of actinomycin D. The 47S rRNA levels were normalized to GAPDH expression and are presented relative to the 0 min time point sample. Data are represented as mean of three independent experiments, with error bars representing standard deviations. (C) Knock down of DDX49 inhibits the pre-ribosomal rRNA synthesis. Left panel depicts a zoomed-out field view of the cells stained with DAPI (blue) and 5-FUrd labeled nascent RNAs (green). The smaller middle panel depicts 2X magnified images of the field. White dotted squares depict the insets provided in the panel on extreme right, where the magnification of a single nucleus is shown. Scale bar is depicted. (D) DDX49 occupies the promoter and regulatory regions of rDNA. Cross-linked chromatin were fragmented and prepared from HEK293 cells and immunoprecipitated with rabbit IgG antibody or DDX49 antibody. The precipitated DNA was analyzed for the enrichment of promoter and different regulatory regions by quantitative RT-PCR. The position of the primers and the schema of the rDNA locus is shown above the graph (H42: –924 to –1042 bp; H0: –51 to +32 bp; H13: +12855 to +12970 bp; H18: +18155 to +18280 bp). Data are shown relative to input and the values represent the mean of three independent experiments, with error bars representing standard deviations.

