Figure 5.
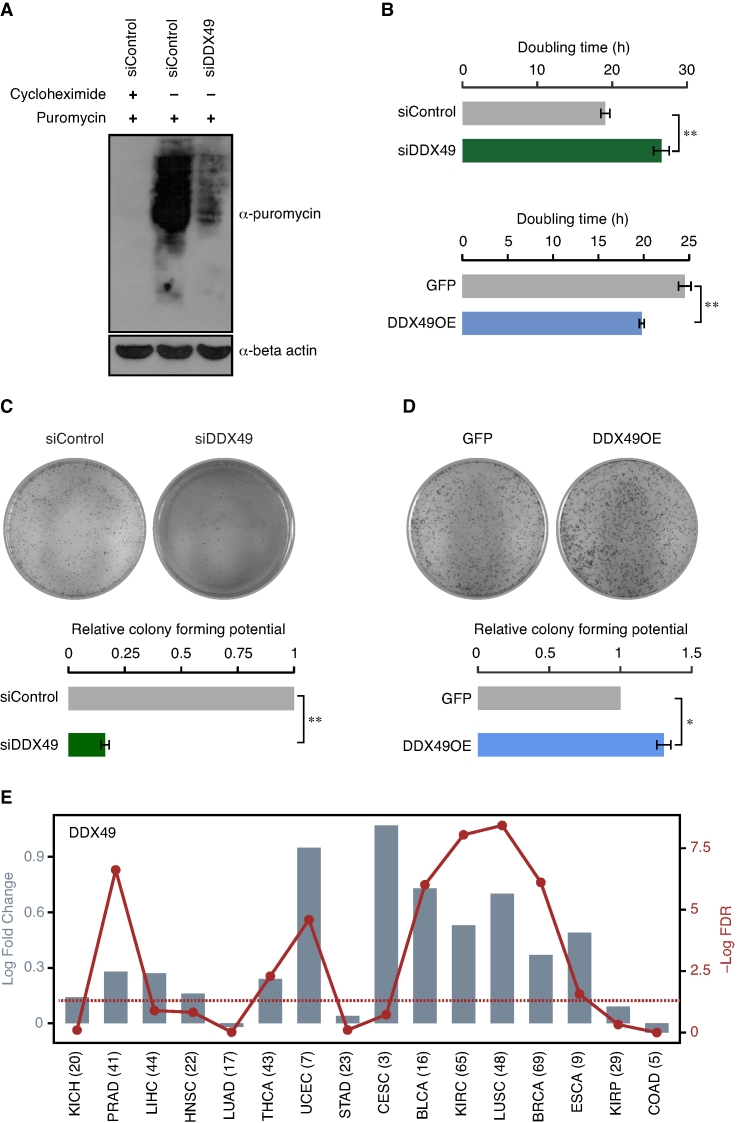
DDX49 regulates the global translation, cell proliferation and clonogenic potential. (A) Effect of the DDX49 perturbation on the translation efficiency in the cells. Western blot shows the levels of nascent polypeptides in control (scramble siRNA) or DDX49 knockdown cells, upon puromycin treatment. The first lane represents the negative control, in which the cells were pre-treated with cycloheximide prior to the addition of puromycin. Immunoblotting was performed with puromycin antibody or beta actin antibody. These experiments were done in replicates and representative image is provided here. (B) Perturbation of DDX49 affects the cell proliferation. HeLa cells were transfected with control siRNA, DDX49 siRNA, pEGFP-C1 vector or pEGFP-DDX49 construct as indicated and the cell numbers were counted at 48, 72 and 96 hours post transfection (Supplementary Figure S9A and S9B). Doubling time was calculated from cell counts at different time points. The values represent the mean of triplicates, with error bars representing standard deviations. Statistical significance was assessed using two-tailed T-test. ** indicates P < 0.01. Perturbation of DDX49 affects the colony forming potential of the cells (panels C and D). The colony forming potential was analyzed in cells treated with control siRNA, DDX49 siRNA, pEGFP-C1 vector or pEGFP-DDX49 construct as indicated. Colony growth was measured by staining with crystal violet 10 days after transfection. Experiments were performed in triplicates and representative images are provided here. Colony counting was done using ImageJ software and the values in the graph represent the mean of triplicates, with error bars representing standard deviation. Statistical significance was assessed using two-tailed t-test. * indicates P < 0.05 and ** indicates P < 0.01. (E) DDX49 is upregulated in diverse cancers. Differential expression of DDX49 in 16 different cancer types is shown as log2 fold changes (represented by bars), with each cancer type abbreviated in the X-axis. The red line shows the distribution of –Log10 FDR values (False Discovery Rates; P-values corrected for multiple testing for each cancer type by Benjamini-Hochberg method), with the dots representing the value for the corresponding cancer type. The dotted line shows the FDR cut-off that corresponds to 0.05, indicating statistical significance. The numbers in the parenthesis represent the number of patients studied for each cancer type. KICH; kidney chromophobe, PRAD; prostate adenocarcinoma, LIHC; liver hepatocellular carcinoma, HNSC; head and neck squamous cell carcinoma, LUAD; lung adenocarcinoma, THCA; thyroid carcinoma, UCEC; uterine corpus endometrial carcinoma, STAD; stomach adenocarcinoma, CESC; cervical squamous cell carcinoma and endocervical adenocarcinoma, BLCA; bladder urothelial carcinoma, KIRC; kidney renal clear cell carcinoma, LUSC; lung squamous cell carcinoma, BRCA; breast invasive carcinoma, ESCA; esophageal carcinoma, KIRP; kidney renal papillary cell carcinoma, COAD; colon adenocarcinoma.

