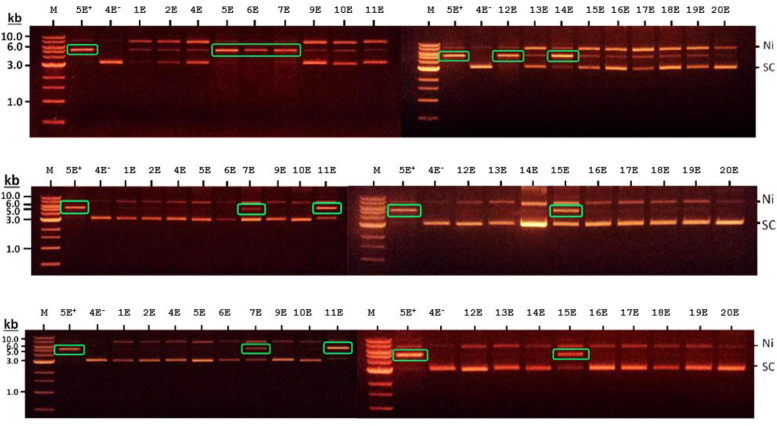
Figure 2.
Agarose gel electrophoresis analysis of samples from a plasmid cleavage assay using the ‘E’ series of plasmids described previously (27). From top to bottom the gels show the effect of the purified HsdR incubated with MSfus, M S and M
 Sfus on the plasmid. The gels show three different plasmid DNA species. The species that occurs at the top of each gel lane has a single strand cut and is ‘nicked’ (Ni). Below this is the linearised species, when both strands have been cut by enzymatic activity (highlighted by green boxes). The lowest species is the uncleaved supercoiled DNA (SC). The lanes marked M are molecular size markers (kb). Lanes marked 5E+ and 4E− are plasmids incubated with HsdR plus CC398-1 MTase that contain a single site or no site for the RE and act as positive and negative controls, respectively.

