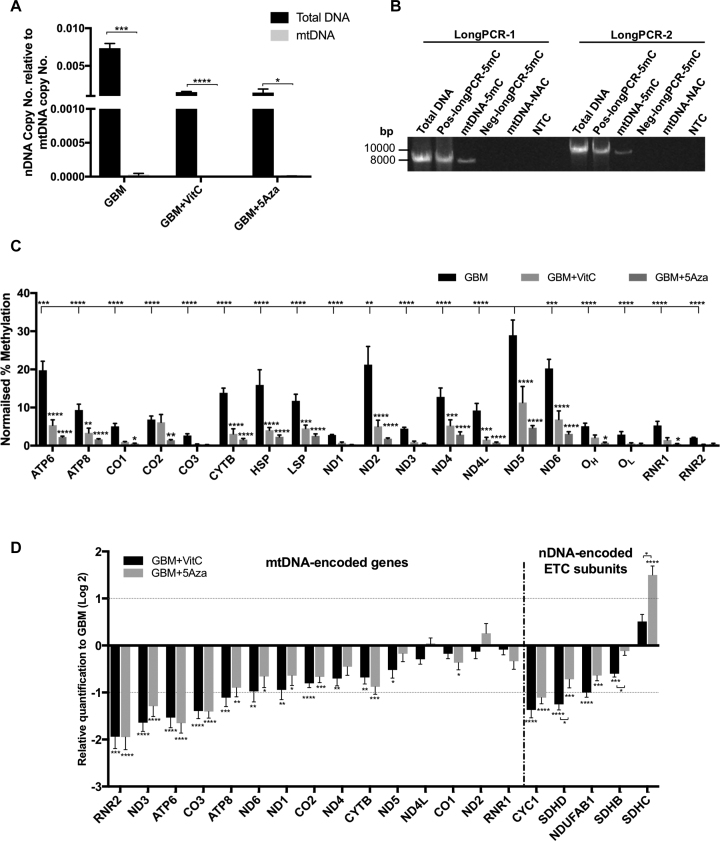
Figure 5.
Levels of DNA demethylation in the mitochondrial genome and expression levels of the mtDNA encoded genes. (A) Detection of nDNA contamination after mtDNA purification. Copy number for nDNA (β-globin) relative to the copy number for mtDNA was plotted. Multiple t-tests were performed between the purified mtDNA samples (gray bars) and corresponding total DNA samples (black bars) isolated from GBM cells. Bars represent the mean ± SEM (n = 3). (B) Agarose gel showing long-PCR products from purified mtDNA samples to demonstrate the presence of mtDNA methylation. Long PCR using two pairs of primers (primer set 2) spanning across the mitochondrial genome was performed on: (i) total DNA isolated from non-treated GBM cells (Total DNA); (ii) the positive control - MeDIP performed on the long PCR products previously generated with primer set 1 and treated with the M.SssI enzyme (Pos-longPCR-5mC); (iii) purified whole mtDNA having undergone MeDIP - (mtDNA-5mC); (iv) the negative control - MeDIP performed on the long PCR products previously generated with primer set 1 (Neg-longPCR-5mC); (v) the non-antibody control for MeDIP – MeDIP was performed on the purified mtDNA without using the 5mC antibody (mtDNA-NAC); and (vi) a non-template control (H2O) for PCR (NTC). Fragment sizes are indicated. (C) Normalized levels of DNA methylation within regions of the mitochondrial genome determined on purified mtDNA samples that had undergone MeDIP with sonication. The normalized levels of DNA methylation were determined by normalizing the MeDIP results (5mC/Input) against the positive and negative controls that were used to represent 100% and 0% of DNA methylation, respectively. Statistical significance was determined between the 5Aza and VitC treated cohorts and the GBM cohort and between ND5 and all the other genes by two-way ANOVA (n = 3). (D) Significant differential expression of the mitochondrial and chromosomal genes encoding the ETC subunits identified in the treated and non-treated cohorts using the Fluidigm array. Bars represent the mean of the relative quantification levels normalized to the GBM cohort (n = 6). *, **, ***, **** indicate P values of < 0.05, 0.01, 0.001, 0.0001, respectively.

