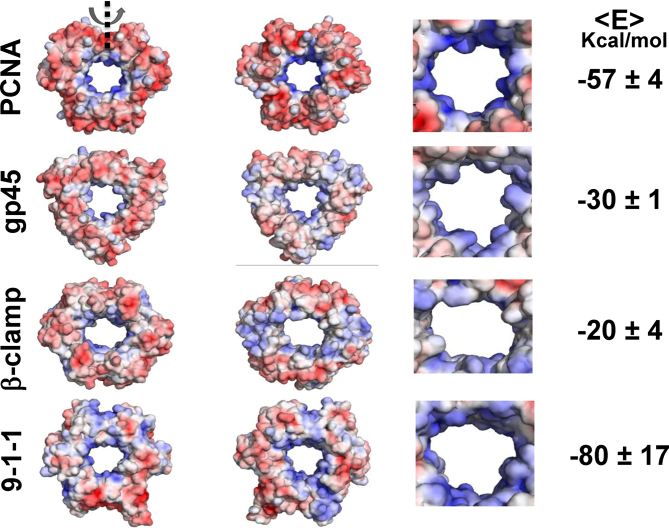
Figure 6.
Electrostatic maps for the toroidal proteins PCNA, gp45, β-clamp and the 9-1-1 complex. From left to right, the electrostatic maps of the ring-shaped proteins are shown from the front, the back, and enlarged (back view). The number on the right corresponds to the average electrostatic free energy of the protein–DNA complex at a salt concentration of 0.125 M (the energy was calculated using APBS (34) and was averaged for different protein positions that were generated by their translocations along nonspecific DNA).

