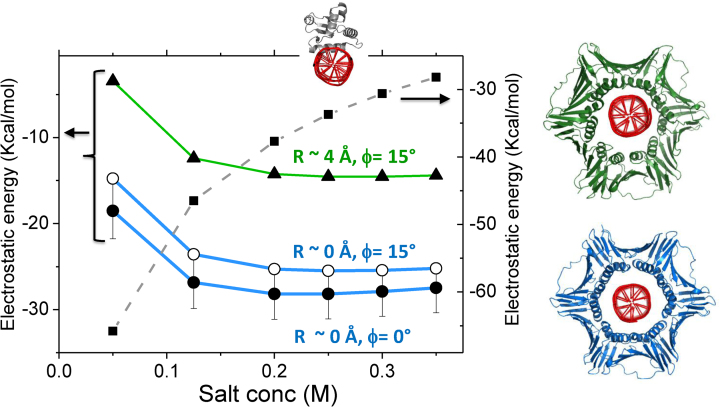
Figure 9.
The electrostatic free energy for interactions of human PCNA with nonspecific DNA. The electrostatic binding free energies were calculated using APBS (34) for three different PCNA–DNA complexes that differ by tilt angle ϕ and the distance R. The binding energy was estimated for different salt concentrations. The complex with R ∼ 4 Å and tilt of 15° (green line) was modeled using pdb ID 5L7C (19) where a direct interface PCNA–DNA is formed via specific salt-bridges. The green and blue curves correspond to complexes with R distance 4 or 0 Å, respectively, and the PCNA in the models (right) was colored accordingly. For comparison, the electrostatic binding free energy was similarly estimated for Sap1 transcription factor (PDB 1bc8). In all cases, a DNA of 30 bp was used for the energy calculations.

