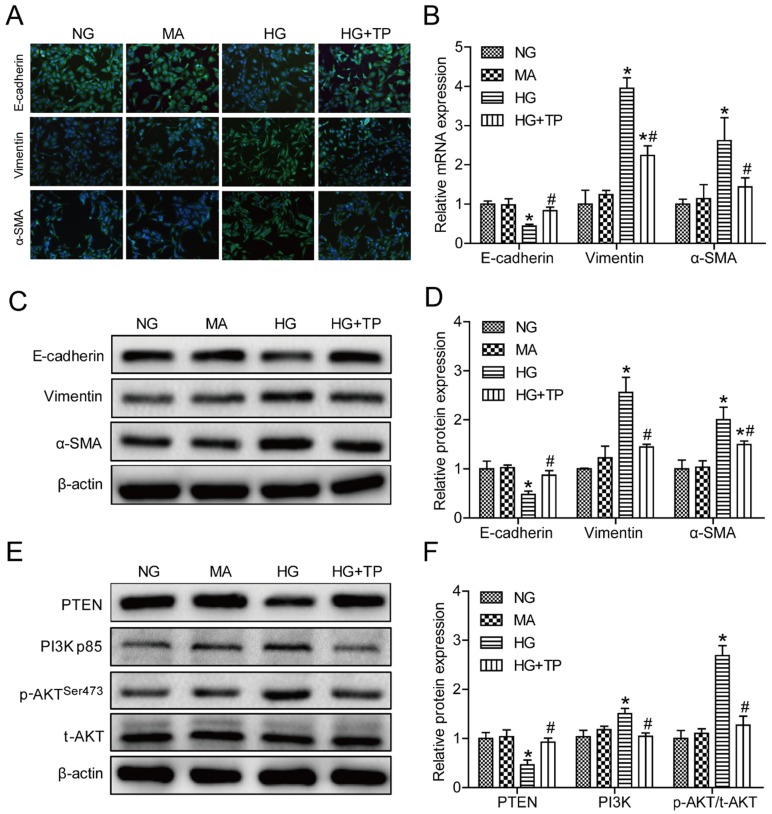
Figure 3.
Triptolide modulated the expression of E-cadherin, vimentin and α-SMA by inactivating the PI3K/AKT signaling pathway in HK-2 cells. (A) Representative images of E-cadherin (green), vimentin (green) and α-SMA (green) by immunofluorescence in HK-2 cells. Blue staining refers to the DAPI-stained nuclei. Original magnification is ×200. (B) Quantification of E-cadherin, vimentin and α-SMA gene expression in HK-2 cells (n=4). (C) Representative E-cadherin, vimentin and α-SMA bands by Western blot in HK-2 cells. (D) Densitometric analysis of E-cadherin, vimentin and α-SMA by Western blot (n=4). (E) Representative PTEN, PI3K, p-AKT and t-AKT bands by Western blot in HK-2 cells. (F) Densitometric analysis of PTEN, PI3K, p-AKT and t-AKT by Western Blot (n=4). Data are expressed as the mean ± SD. *P < 0.05 vs. the NG group. #P < 0.05 vs. the HG group. NG: normal glucose; MA: mannitol; HG: high glucose; TP: triptolide.

