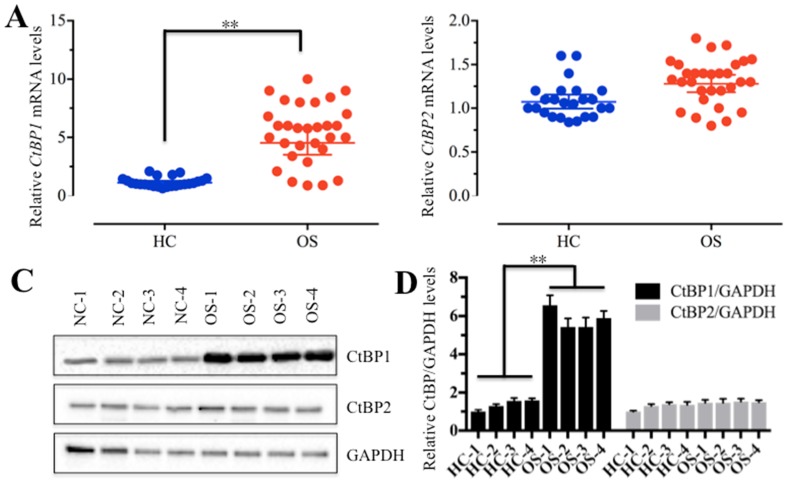
Figure 1.
CtBP1 is overexpressed in osteosarcoma tissues. (A and B) The relative mRNA levels of CtBP1/2 in noncancerous (HC, n=24) and cancerous (OS, n=30) tissues determined by qRT-PCR. **P<0.001. (C) The protein levels of CtBP1/2 in noncancerous (HC, n=4) and cancerous (OS, n=4) tissues. GAPDH was used as a control. (D) Statistical analysis of the protein levels in (C). **P<0.001.

