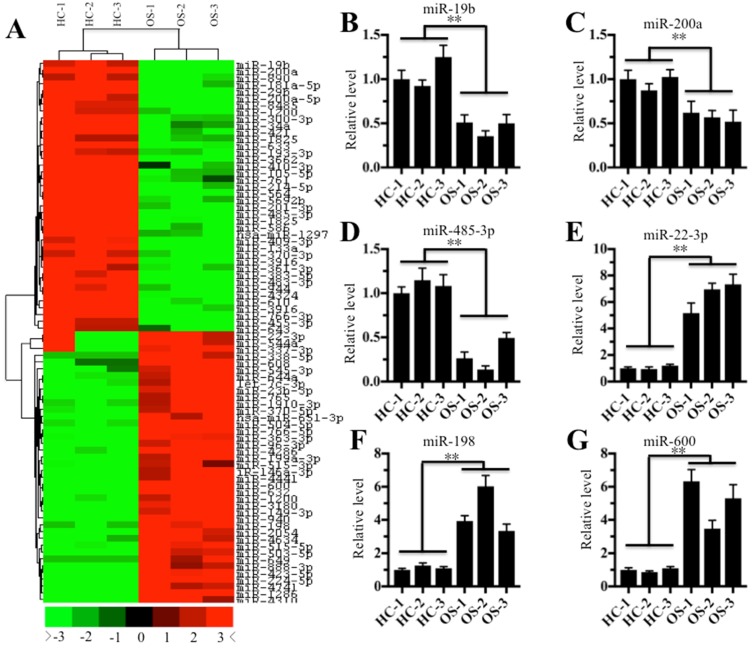
Figure 3.
The miRNA expression profile in osteosarcoma tissues. The heat maps of the consistently downregulated and upregulated miRNAs in osteosarcoma tissues. MicroRNAs from three noncancerous tissues (HC-1, -2 and -3) and three cancerous tissues (OS-1, -2 and -3) were subjected to microarray analysis. The heat maps indicated high (red) or low (green) levels of miRNA expression. (B-G) Verification of miRNA levels in osteosarcoma tissues by qRT-PCR. The qRT-PCR was performed to verify the expression of three downregulated miRNAs, including miR-19b (B), miR-200a (C), and miR-485-3p (D), and three upregulated miRNAs, including miR-22-3p (E), miR-198 (F), and miR-600 (G). ** P < 0.001.

