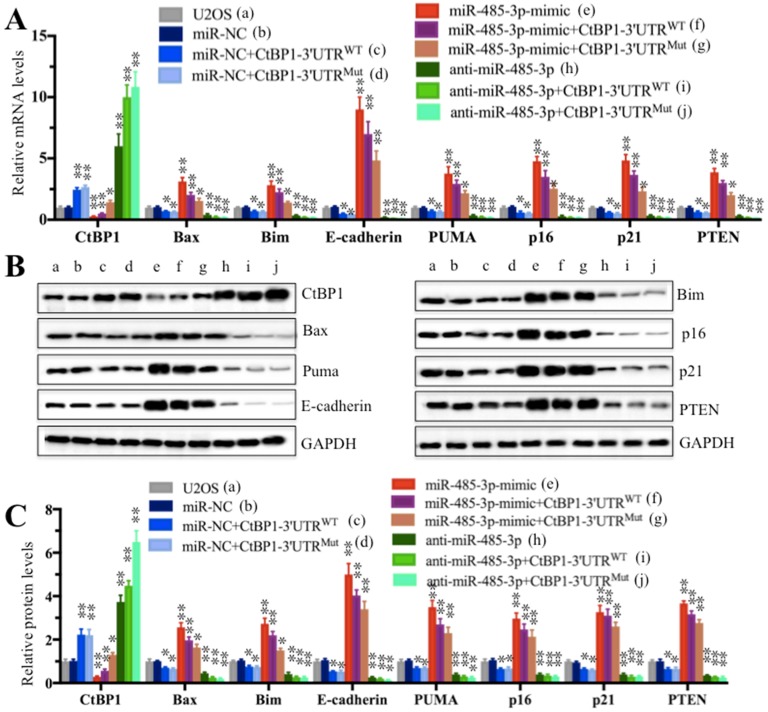
Figure 5.
The miR-485-3p-mimic upregulated the expression of CtBP1 target genes. Cells used in Figure 4C were subjected to examine the mRNA levels (A) and protein levels (B and C) of CtBP1 downstream targets, including Bax, Bim, PUMA, p16, p21, E-cadherin and PTEN were measured by qRT-PCR and Western blot, respectively. ** P < 0.001.

