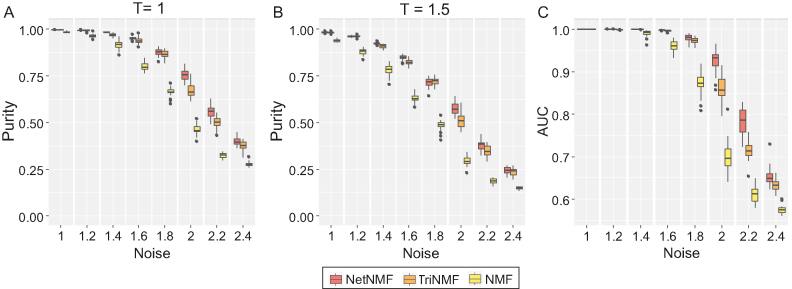
Figure 2.
Performance comparison of NetNMF, NMF and TriNMF in terms of purity as well as AUC in simulated datasets. (A and B) The boxplots of purity scores for identified co-modules in 30 realizations on the simulated data with respect to different noise levels. Different thresholds (T = 1 for (A) and T = 1.5 for (B)) are used for selecting features from both factored matrices G1 and G2. (C) The boxplots of AUC scores without any pre-defined parameters in the same 30 realizations.

