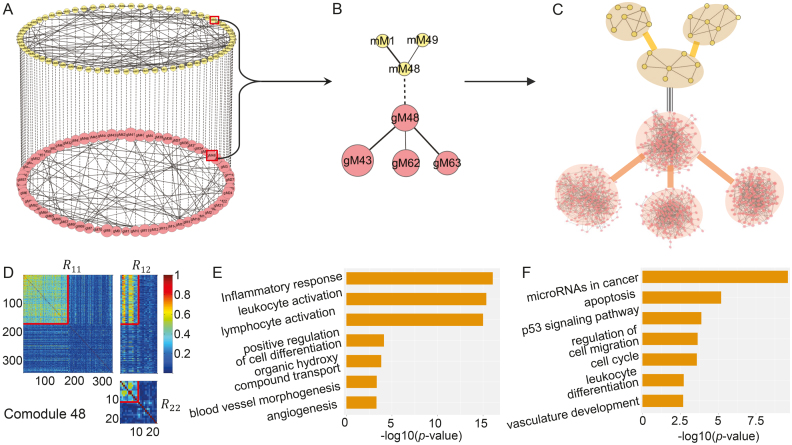
Figure 3.
Illustration of the two-layer module network using TCGA breast cancer dataset. (A) The miRNA–gene module network consists of 69 miRNA modules in the top layer, 69 gene modules in the bottom layer, 69 edges (dash lines with equal weights) of one-to-one matching miRNA–gene co-modules and 99 edges between gene modules and 88 edges between miRNA modules weighted by the corresponding values in factored matrices S11 and S22, respectively. gMx (or mMx) indicate a gene (or miRNA) module with index x. (B) The module 48-centered subnetwork. (C) The detailed network for each module in (B). Some pairs of miRNAs in one miRNA module are linked if the two miRNAs share at least one target. The gene network for one gene module is constructed based on GeneMANIA (41). (D) Heat map of co-module 48 consisting of 171 genes and 11 miRNAs (squared boxes) based on the input similarity matrices of NetNMF. We extended the heat map to cover more variables by randomly selecting 171 genes and 11 miRNAs for contrasting. (E and F) Top biological terms enriched in the gene modules (E) and miRNA modules (F) in (B). The enrichment ratio indicates the functional significance of a module with −log10 (P-value) (Bonferroni-corrected P-value). Similar setting is used in Figure 5.

