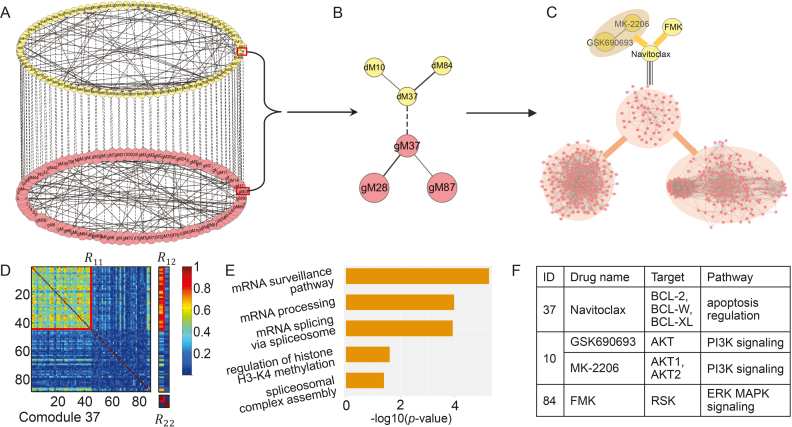
Figure 5.
Illustration of the two-layer module network using the CGP dataset. (A) This gene–drug module network includes 88 gene–drug co-modules, 122 edges between drug modules in the top layer and 113 edges between gene modules in the bottom layer. (B) The module 37-centered subnetwork. (C) Both drug module 37 and 84 contain only one drug; drug module 10 includes two drugs targeting the same pathway (F). (D) Heat map of co-module 37 consisting of 44 genes and one drug (squared boxes). (E) Top enriched biological terms in gene modules in (B). (F) The details about drug modules in (B).

