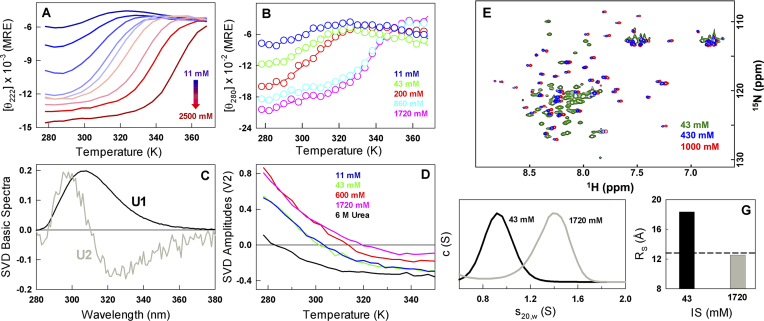
Figure 2.
Charge screening promotes a continuum of structural states in CytR (A and B). Far-UV and near-UV CD unfolding curves at varying ionic strength conditions. MRE represents mean residue ellipticity in units of deg. cm2 dmol−1. (C and D) Global singular value decomposition (SVD) of temperature–wavelength fluorescence data of CytR unfolding at different ionic strength conditions. The first and second basis spectra (which shows a red shift) are displayed in black and gray, respectively. The amplitudes of the second basic spectra as a function of temperature are shown in panel (D) highlighting the temperatures at which they change sign depending on the stability conditions. (E) Overlay of 15N,1H-HSQC spectra at 43 mM (green), 430 mM (blue) and 1000 mM (red) ionic strength conditions. (F and G) Corrected sedimentation velocity distributions and the apparent Stokes radii (RS) of CytR at the two extreme ionic strength conditions. The dashed horizontal line in panel (G) signals the dimensions of a perfect sphere.

