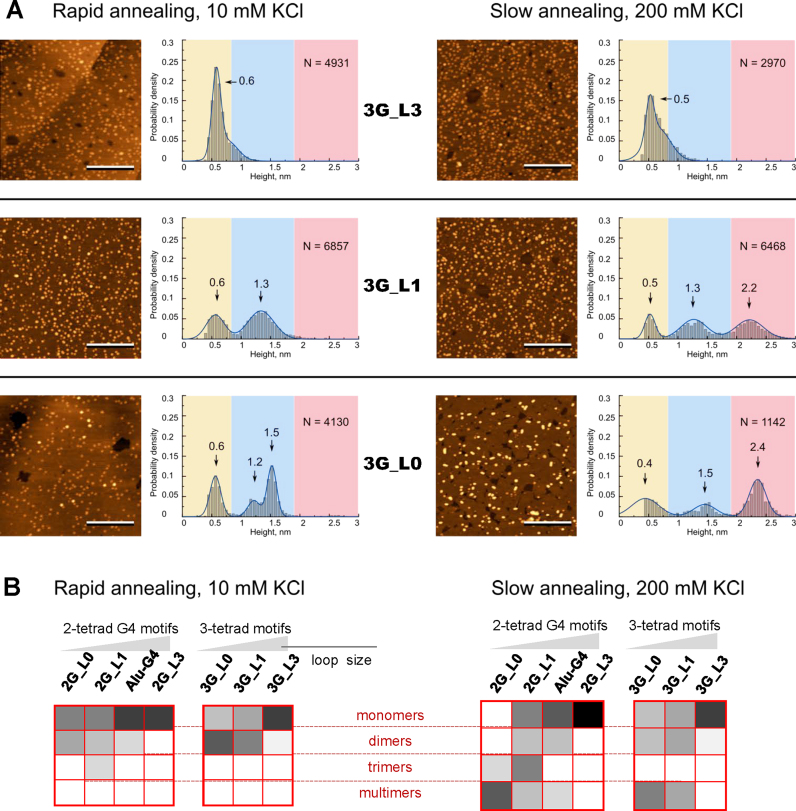
Figure 3.
Morphology of 3-tetrad G4 motifs (A) and summary of relative contributions of different structures (B) revealed by AFM. AFM height images and corresponding height histograms were obtained after rapid sample annealing at 10 mM KCl concentration (left) and slow annealing at 200 mM KCl concentration (right). The length of the scale bars is 100 nm. N is sample size. Color gradient in (B) indicates the contribution of a particular structure: from 0 (white) to 100% (black).

